


Client
Elinext is a custom software development company, and this project is our internal one. Like many other solutions we develop for our ecosystem, this one is aimed at simplifying the everyday life of employees.
The core of the software can and probably will be used to speed up the development of a related custom product for our clients.
New customers at Elinext save significant parts of their resources by choosing to go with a customized version of a product that already exists.
Project Description
The Elinext Data Visualization application is a handy tool for acquiring the necessary data from different outer sources and manipulating it.
Web applications for the accumulation and manipulation of data from third-party systems are all about presenting the data in the needed formats. Here is what functionality has been up for realization:
- creating tables, that accumulate data in one place
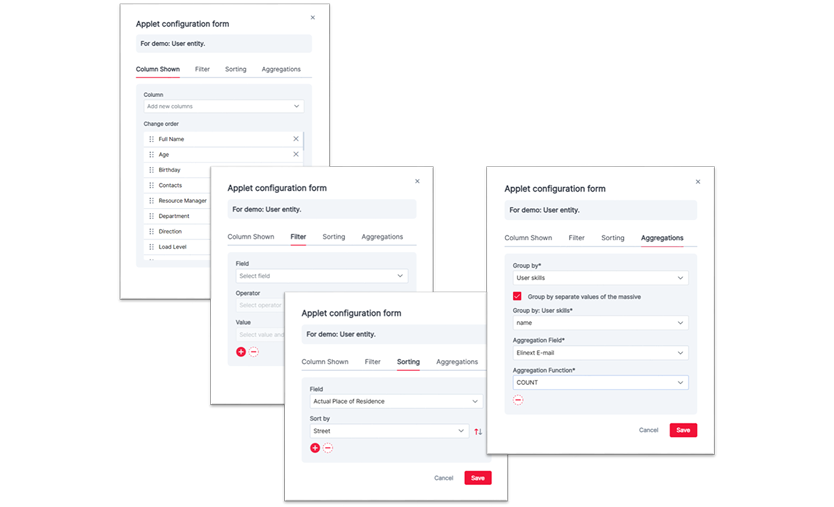
- managing the display and order of the existing fields
- configuring extended filters and sorting parameters
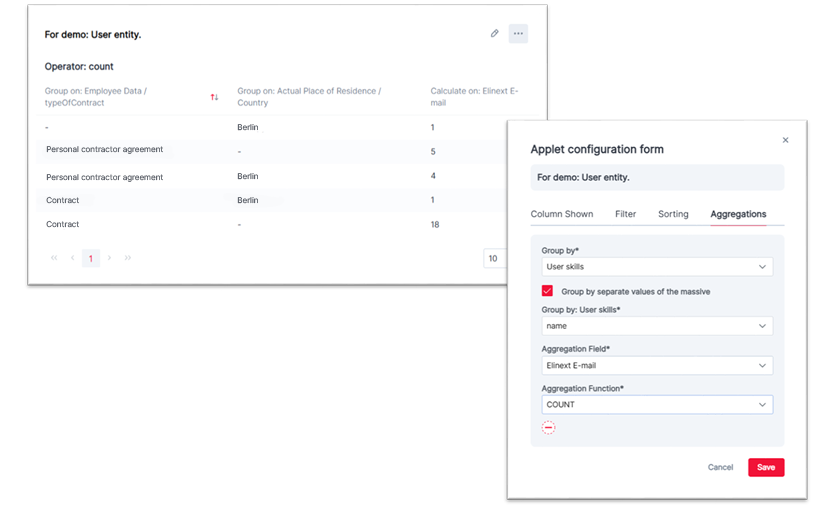
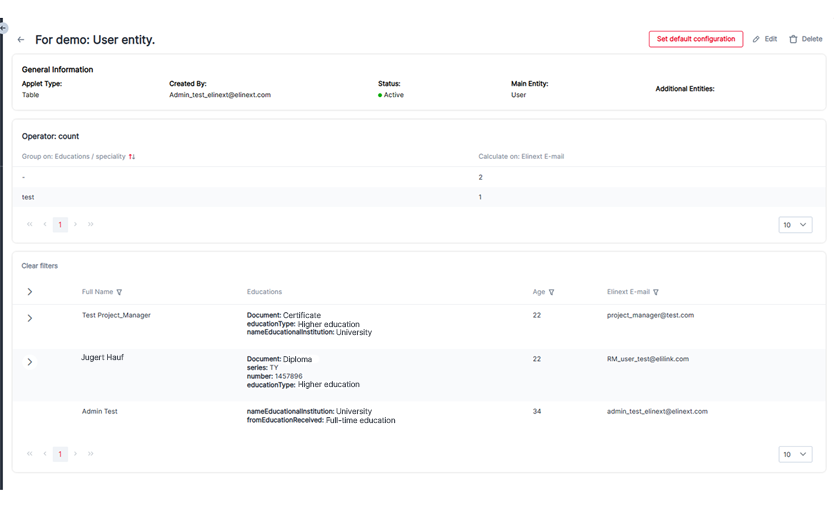
- applying aggregations within the filtered data
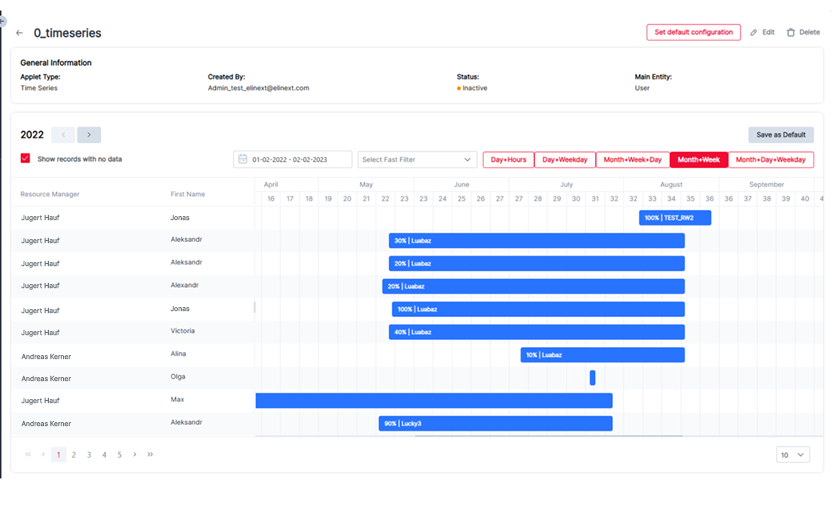
- creating Gantt charts for better data visualization
- creating and managing dashboards for easy data perception
- different data display (tables at the moment, in the upcoming versions)
- creating new Data Sources for receiving new fields
- assigning readable names for the received fields
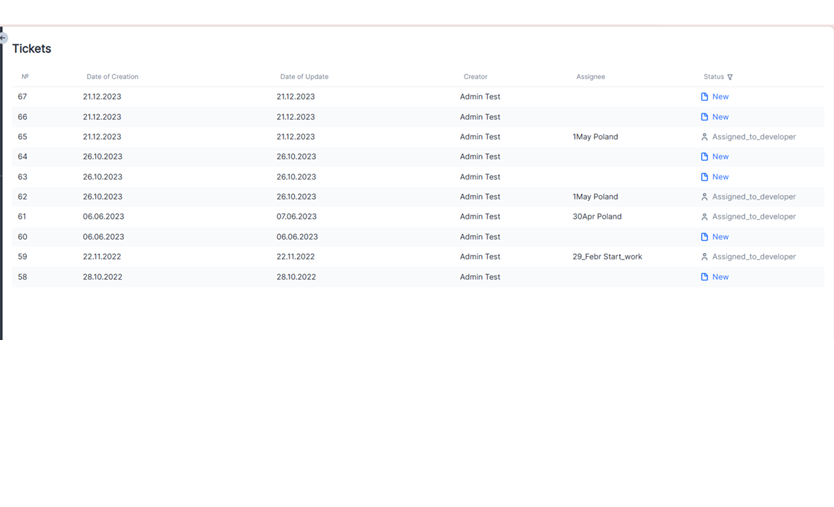
- dealing with problem tickets and their lifecycle
We got a single source of accumulated data for fast reports as the project was up for realization.
Challenges
The reason for starting the project was the necessity to facilitate resource management; and to create one source of accumulated data for fast reports, which is presumed to save time on searching for the parts of information in different places.
Regarding the processes, the main challenge was to maintain a continuous implementation process in the conditions of team rotation. It is a common issue with internal projects, as so-called “commercial” projects tend to be prioritized.
Maintaining knowledge transfer during team rotation was achieved with the following measures:
- Confluence page with crucial technical information for new developers.
- Comments explaining solutions for complex technical tasks.
- Interlinked tickets for easier issue investigation.
- Dev-to-dev knowledge transfer meetings during team member changes.
- Peer code review (when possible).
- Cross-System Access Management Complexity:
Cross-System Access Management Complexity:
- Integration challenges due to different access schemas across various systems.
- Additional difficulty is caused by complex fields and cross-entity applets.
Implementing Aggregation Functionality in Non-Relational Database:
- Difficulty in implementing aggregation features on MongoDB (non-relational database).
- Challenges are overcome through extensive research and development.
Refactoring and Rewriting Due to Evolving Requirements:
- Initial simple component designs became insufficient for expanding functionality.
- Need to refactor and rewrite components to handle complex fields (including nested objects) and advanced filtering configurations.
Process
As for the processes the Kanban-like methodology was used on the project, as it best suits the situation with unlimited in-time projects with a team rotation.
From the technical point of view, many parts of the functionality were new to the team and required deep investigation (aggregation on the not-relational database, filtering on complex fields, cross-system access management, cross-entity applets issues, and others).
The development process was very flexible to meet the requirements, which are often changed because of the numerous dependencies and limitations.
There were several versions of the product, one of them is in the process of making, and the fourth one is an upcoming
Version 1.
The project was initiated in January 2021. The team faced challenges with the permissions schema realization. The first release took place in March 2023 as there were many team members' rotations.
The released version included the base functionality of table applets, simple filtering, and sorting. The access management system and integration with one Data Source were also ready.
Version 1.1
Released in July 2023.
The intermediate version included bug fixing and some improvement of the filtering functionality, big values representation improvements.
Version 2:
Released in November 2023.
The version included new aggregations functionality, sufficient complexification of the filtering component for working with complex fields and fields with massives, aliases functionality improvements, UI/UX improvements, quick filters addition, CV download functionality, and functionality for filtering and sorting on the hidden fields.
After this version’s release, the application could provide a real possibility for management and analytical work. The access management was also sufficiently improved.
Version 2.1
Released in January 2024.
The intermediate version included bug fixing and some additional functionality: further UI/UX improvements, a default dashboard, column filters, and navigation to the employee’s profile in the Talents system right from the applet.
Version 3
Will be released soon.
A new type of applet (Time Series) functionality is expected to be added to the system, as well as further code improvements, UI/UX improvements, changing the order of records in the list of dashboards, custom column filters, and applet descriptions configuring a new Data Source (another internal software product: Vacation Manager).
On top of this, a large amount of backend work is to be done to automatize some processes that have previously been done manually.
After that, another version of the application is planned.
The project coordination, processes, team load, and ticket distribution are conducted by the business analyst.
Solution
There are two main modules: the user module and the admin module.
User Module
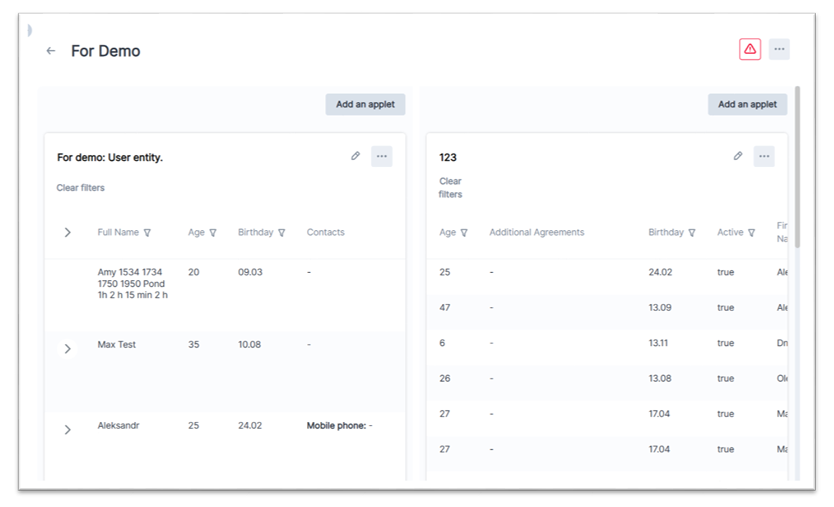
The part of the system that is available to Elinext employees. The main functionality is dashboards. Any dashboard can be supplemented with applets, that have been created and published by the Administrator of the system. The user can configure his dashboard representation and the settings of each applet according to his needs.
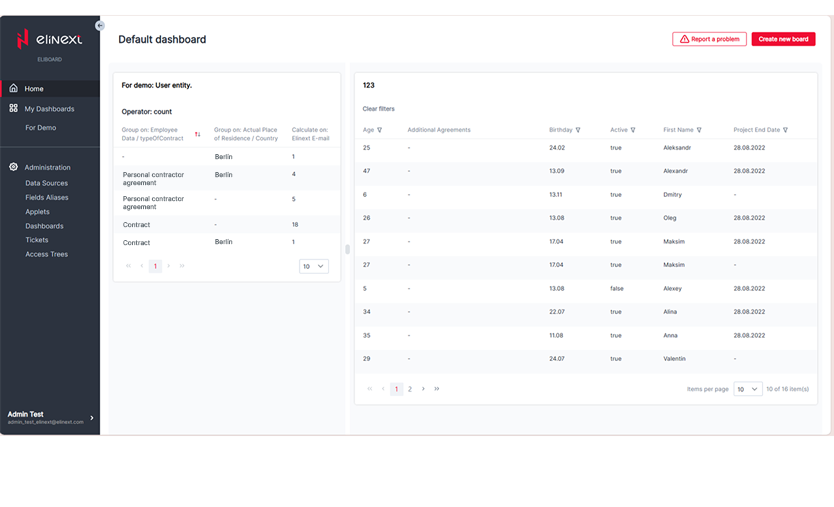
Home page
Here each user can choose the most important dashboard to be shown as default.
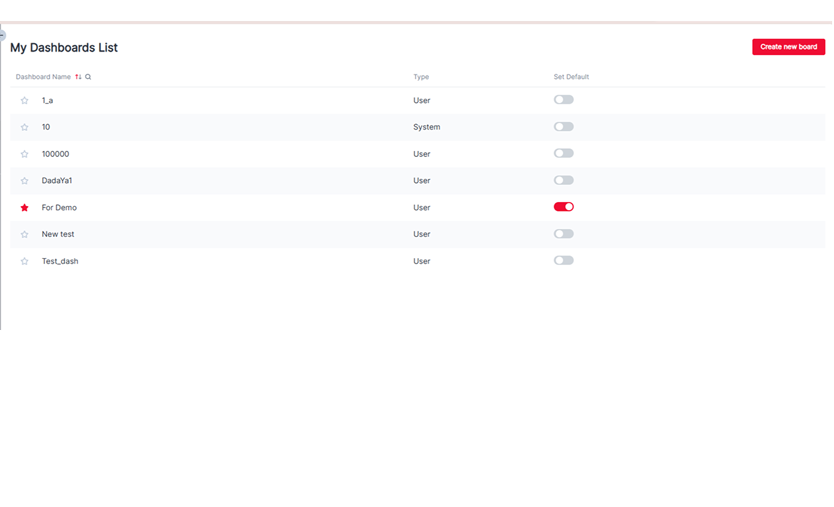
My Dashboards
The list of user and system dashboards. Up to 5 dashboards can be chosen as favorites – they will be shown as separate links in the sidebar menu. The list can be sorted, and the order of the records can be changed as per the user’s needs. A new dashboard can be created for a particular user.
Dashboard Page
Each user dashboard can be configured according to the user’s purposes: change layout, add, delete, and move applets (separate reports with a certain set of data in each) on the board. Each user applet can be configured independently. The dashboards are commonly available and can’t be changed by a user in the current module.
Applet configuration form
This component (modal window, available on the dashboard page) offers flexible means for data management.
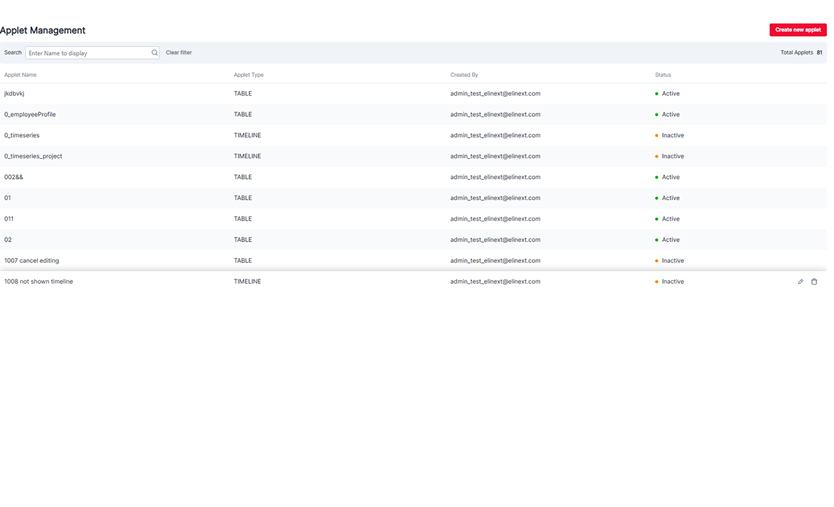
Administrator Module
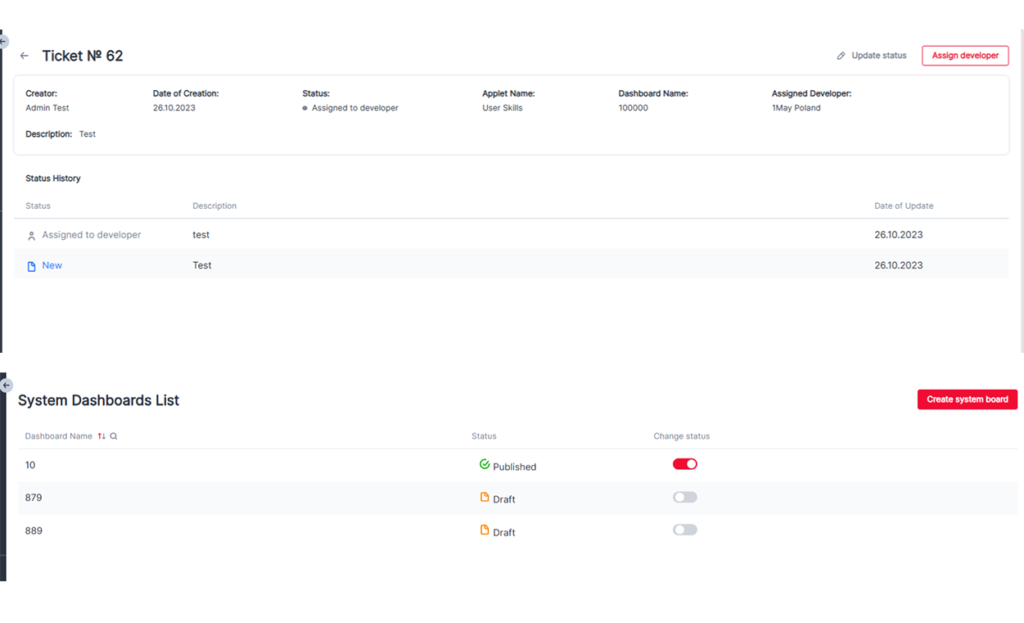
The Admin prepares applets and publishes them for the common use. The module’s functionality isn’t limited by it. This module includes support tasks, making system dashboards, dealing with problems, and integration information.
Here is the list of features accessible by admins.
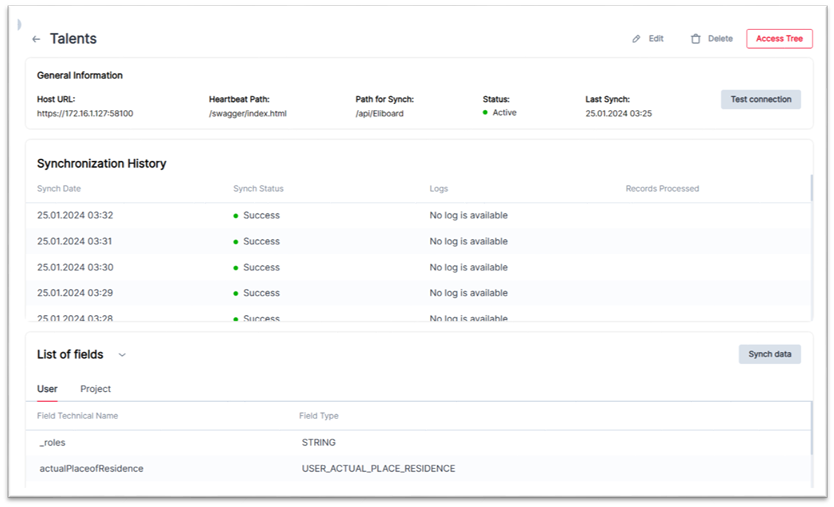
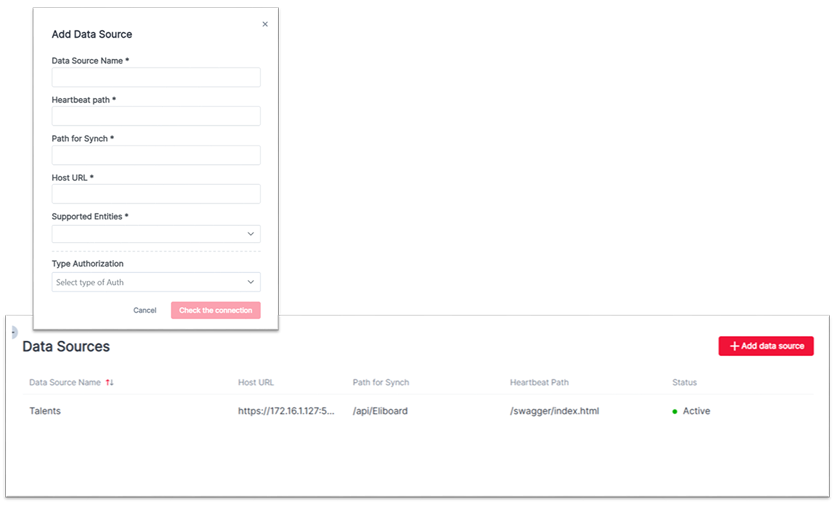
- Data sources list
- Data source details page
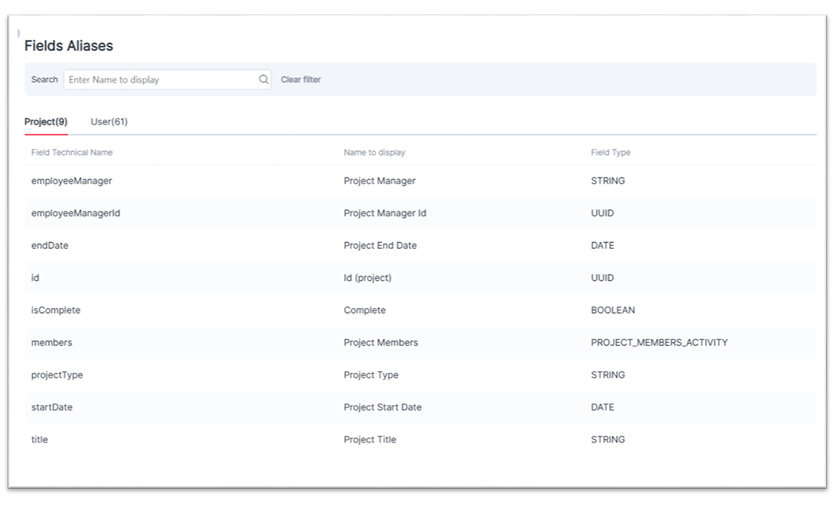
- Fields aliases
- List of applets
- Applet details page
- Type of applets
- System dashboards
- Tickets
- Ticket details page
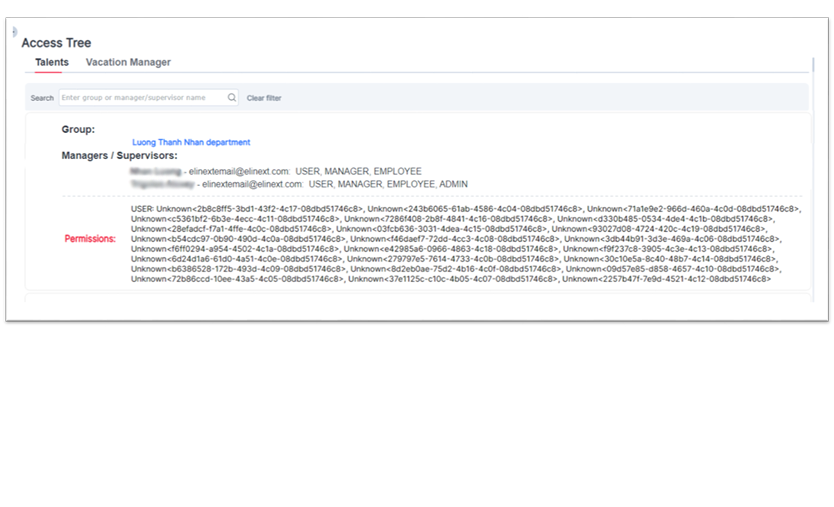
- Access Tree
The project is still in progress and some features, as well as the user experience improvements, code improvement are under implementation. For example, it is planned to add a possibility to present the results of aggregation in the form of pie or bar charts.
Results
The end product is a nice tool for simplifying the job of the resource managers and their communication with their employees. It is an internal ongoing project with no defined end time.
From the POV of a professional developer’s growth, each team member could improve his expertise in different technologies, access management variants, deep dive into filtering and aggregation functionality, work with charts, and work with a non-relational database.
As for the solution, it is a viable software system which is already in use in our company but is being constantly improved when we have work capabilities. Versions 3 and 4 of the system are planned. Further ideas and requirements may occur and will be implemented.