Client
A newly formed Canadian company who provided a SaaS for selling industrial equipment used Elinext to build a sales management application.
Challenge
The company had been using a preset tool to visualize sales data on a map until they realized it wasn’t sufficient. In order to solve this problem, they conceived a custom application in the form of an interactive map. Sales reps could highlight their remit on that map and study businesses within it representing customers and sales leads.
However, the company didn’t have developers to build the application on their own, nor did they have experience in outsourcing. So they looked for a developer and came across Elinext. We had previously built a very similar product, which we showed to their CEO, successfully convincing him our team was the right match.
Process
The client allotted two people to guide and monitor our work through conference calls once-to-twice a week, touching base via chat in between whenever needed.
A Swift Start
We used the previous, similar project as a basis, effectively duplicating its structure. That approach allowed us to decompose the task and draft the roadmap in a matter of hours.
We duplicated the original architecture in one month, pairing Spring Boot with the Angular client/server application. After that, we tackled the most specific functionalities as conceived by the client. And while building that out, we came across three minor challenges.
Heaps of Data, Wrong Addresses and Stats
The application was designed to serve up to 40,000 sales reps. And that meant we had to sort out how to make it capable of processing heaps of data. However, this didn’t take us unawares — we just needed to properly reapply what we had successfully done before.
Another, and less familiar challenge, was about locating businesses. To do so, we had to work around incomplete and incorrectly presented business addresses. And we found a solution by integrating the application with Geocoder, a third-party tool that allows you to identify location by several parameters.
Setting up year-over-year (YoY) sales statistics was another interesting challenge. Since the application processes a lot of data varying in quality, tuning up calculations took some doing on our end.
Final Stages
The first version of the application was ready, and the time came for testing it. Our QA engineer spent the next 1.5 months handling swathes of data: the biggest table consisted of up to 10 million records.
Meanwhile, the client had been adding new features to the backlog. Once quality assurance had been completed, we moved to building those features out. It took us around a month to put them together and fine-tune the application.
Finalizing the Project
At some point, our part was over. We converted the application into a .jar file, as suggested by the client, and handed it over to them. But we didn’t end collaboration there: the project team helped the client put the software to work and ensure it ran well in their environment.
Product
The app we built for the client is so versatile it can be used for selling almost anything. Let’s take a look at its main modules.
Map
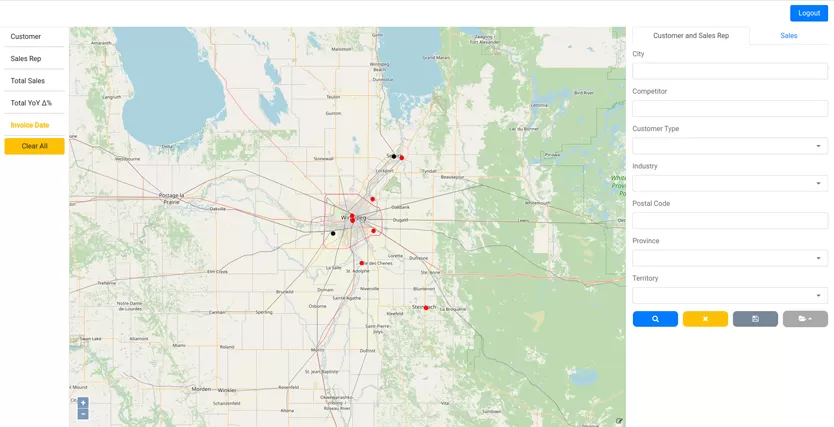
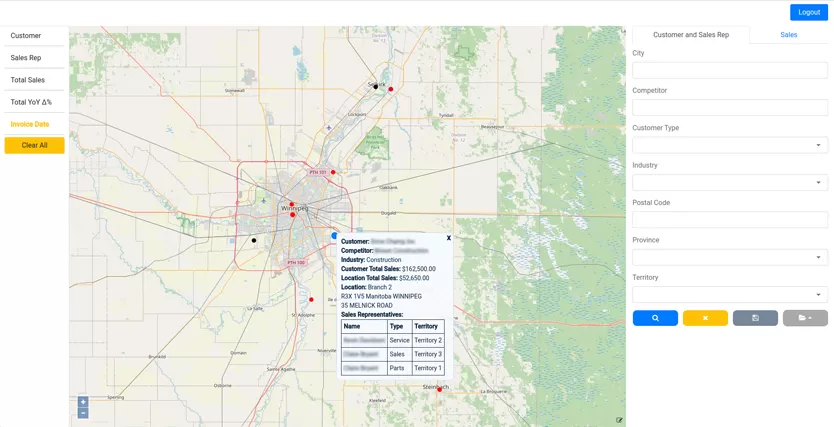
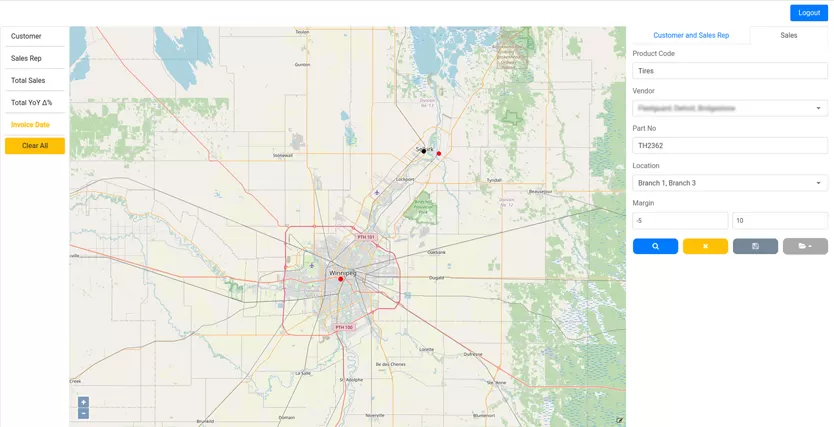
Territory sales reps can highlight their remit on the map. Within its borders, they’ll see pin drops representing addresses of their customers and leads, zooming in for more details. The addresses and details are added in the system by the software company (our client).
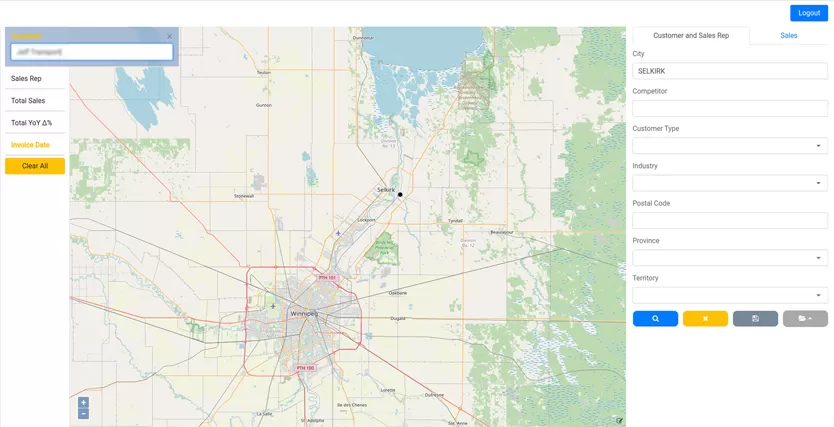
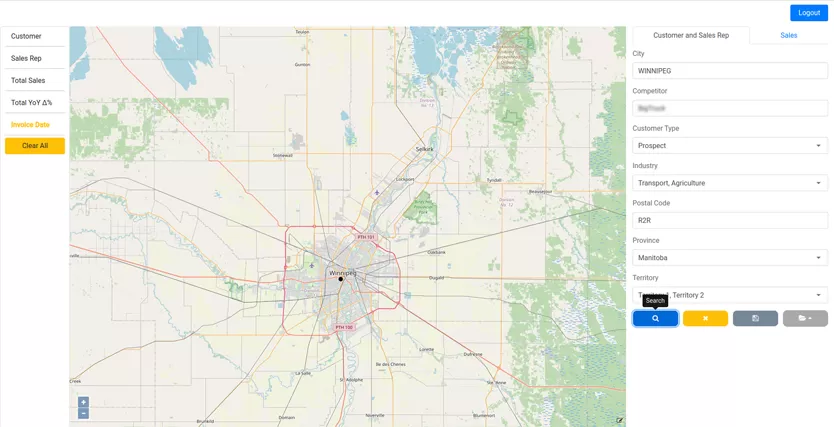
To make finding the right businesses easier, we built two modules, left and right of the map, dubbed ‘the form’ (right) and ‘the filter’ (left).
The Form
If you're a sales rep, you can use the form to sort the pin drops in your remit by a set of parameters. These parameters include:
- City
- Territory
- Province
- Postal code (usually the first three digits)
- Sales rep assigned
- Customer
- Total sales (i.e., customer in area with more than 100k sales)
- Industry
- Competitor
- Customer type
Once you’ve chosen one or more parameters, you will only see the related pin drops.
The Filter
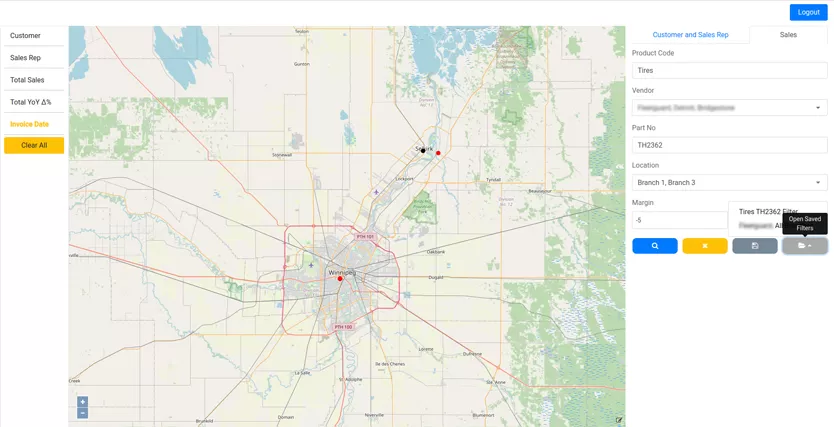
The filter works in a manner that is similar to the form. It allows you to find businesses on the map through searches based on parameters like these:
- Customer (business name)
- Sales rep assigned
- Total Sales
- Total YoY, %
- Invoice Date (Ranges)
- Part Number
- Margin
- Product Code
- Vendor
Admin Panel
We also built a simple administration panel allowing our client to upload the favicon and make some minor changes to how the application works.
Results
Completing the project took longer than we had estimated. But that was mainly due to the client adding new features and green lighting every change that improved the quality of the software along the way.
What the client particularly liked about our job is that we had kept them up-to-date in a very consistent manner. In fact, they had never once had to contact us first.
We believe we developed a stellar product that will help our client’s software users sell more goods and spend less money.


