Client
Elinext is an international custom software development company. As a tech company, we always have to be online, and the infrastructure should never be harmed. Early detection of any malfunction drastically helps to minimize the damage. We develop lots of software pieces that help us with our everyday operations, and network monitoring software is also one of them.
Project Description
Network Monitoring is a web solution that is aimed at identifying issues in the operation of numerous IT infrastructure services and notifying users about the issues.
The solution uses the concept of a standard health check application: monitoring provides insight into the health of services in near real-time. It was developed mainly to minimize time and material losses caused by late detection of failures and malfunctions.
Among the key features that web application consists of are user role management, projects, services, and metrics management. Also, the stats feature and notifications have been implemented.
Challenges
Previously, the company did not have an application that could define issues in the IT infrastructure, for example, due to a power outage, and promptly notify administrators about it. Therefore, we could find out about the issues that arose later than we could have, and the decision was made to develop such a system for the company.
Process
At the moment, we’re entering the second phase of development (beyond MVP). At the moment, we can highlight the following stages:
Phase 1: November 2022 – December 2023
MVP development: Renew the existing web application. The team had to develop a new UI/UX design from scratch and refine all the modules the application consisted of.Phase 1.1: January 2024 – March 2024.
Since the beginning of the year 2024, several refinements have been made. Alongside many UI improvements and code refactoring, these were the changes that the team worked on during Phase 1.1 within the three-months span:- Added the ability to copy the metric within one service
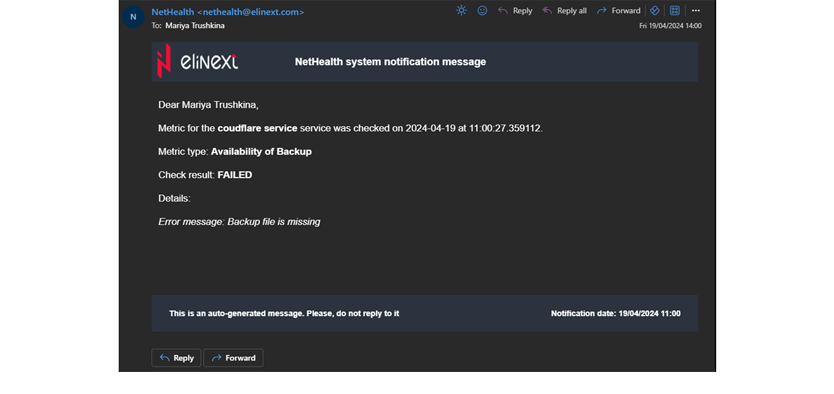
- Added metric check results in the email notifications
- Removed the “Responsible project admin” role from the Project model
- Removed the service types and URL/IP field from the Service model
- Made updates connected with migration to the Identity Server v.
Phase two is upcoming. The entire scope has not been clarified yet, but it will definitely include UI refinements, the possibility of making the columns visible/invisible, implementation of SNMP protocol for metrics check, and other features, including but not limited to:
- Implementing Telegram notifications
- Scanning the internal sites for broken links
- User group management
During the first 6 months of the project’s existence, the team was using Scrum methodology (sprint duration of 2 weeks). Then, we decided to use the Kanban methodology. This methodology was more convenient because of the ever-changing availability of the development team. We kept using some Scrum entities (i.e. daily meetings, retrospectives)
Throughout all the phases, the team was always searching for improvements in the user workflow and UI. That resulted in a much more user-friendly UI than it was initially.
We could have released MVP earlier. Reason: the team was constantly understaffed during the testing phase because the members were working on external projects. But in the end, we quickly prepared for the release thanks to the strong QA who joined our team.
Solution
Build an internal web system that includes simple IT infrastructure monitoring functions with the possibility to send alerts if something goes wrong. and a set of features. Here is a short description of them.
Module One: Project
The project is the main object in the system. The project contains several services, and the service contains metrics that need to be checked. This hierarchy may be useful to divide the considerable number of metrics.
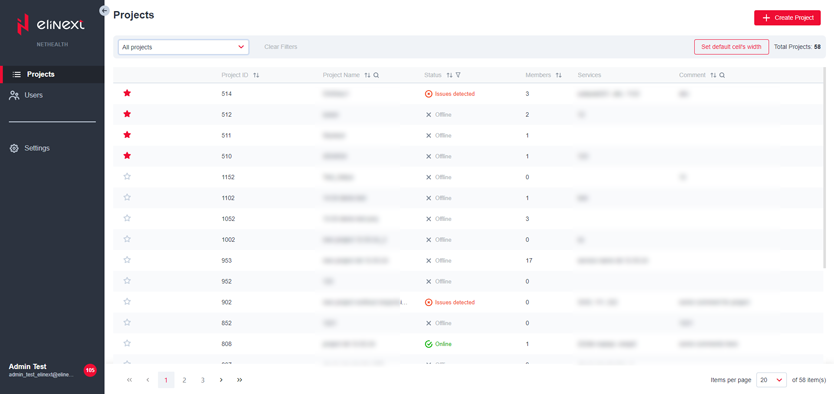
In the projects grid, the user can quickly observe the state of all objects overall – every project inherits status from the services inside of it.
The module includes:
- View all the projects in a grid
- Filter and sort information in the grid columns
- Filter the grid by favorite and all projects
- Adjust the columns' width and set the width to default
- See the project status
Besides, one could obviously CRUD projects and specify the project info in the comments.
Feature: Member Settings
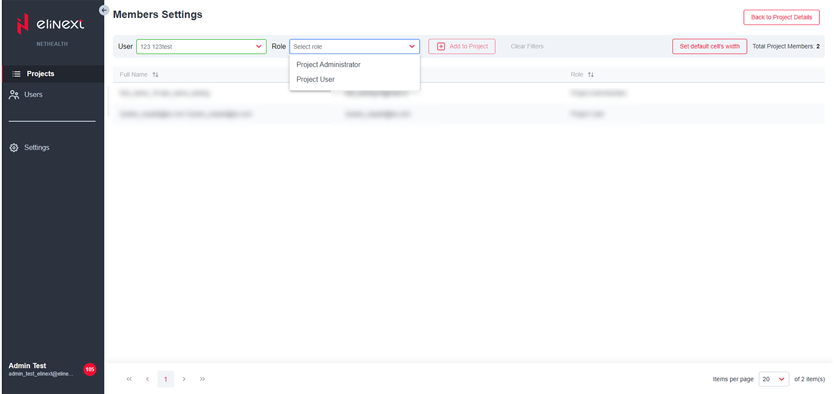
Admins grant access to the projects to users from the identity server via this feature.
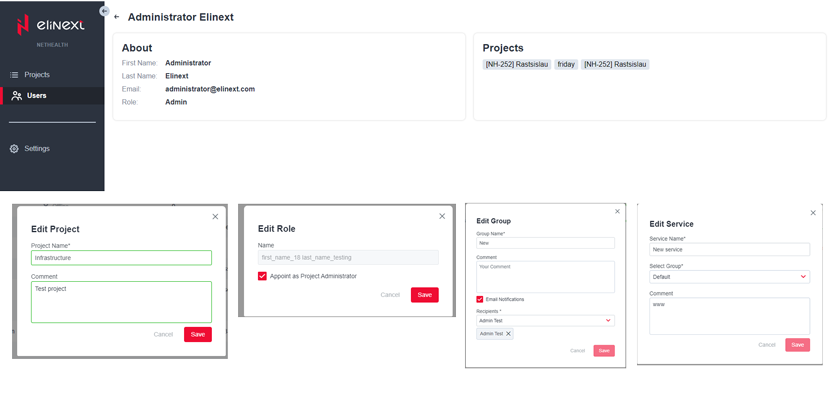
Here one could manage a member’s list, including viewing all the members in a grid, filtering info in the grid of columns, and adjusting the width of these columns. Admins can add and delete members, as well as edit their roles. At the same time, the administrator does not need to create an account; he just needs to select the person in the dropdown and assign him a project role.
Feature: Groups Settings
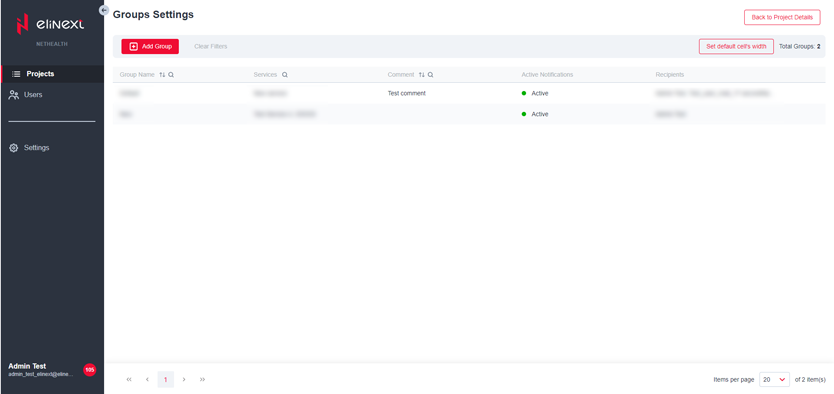
This is an opportunity to divide a wide range of services into several groups on any grounds. This feature allows doing just that. Group settings allow to enable or disable notifications for services. The user can select a specific notification recipient among project members.
Feature: Services
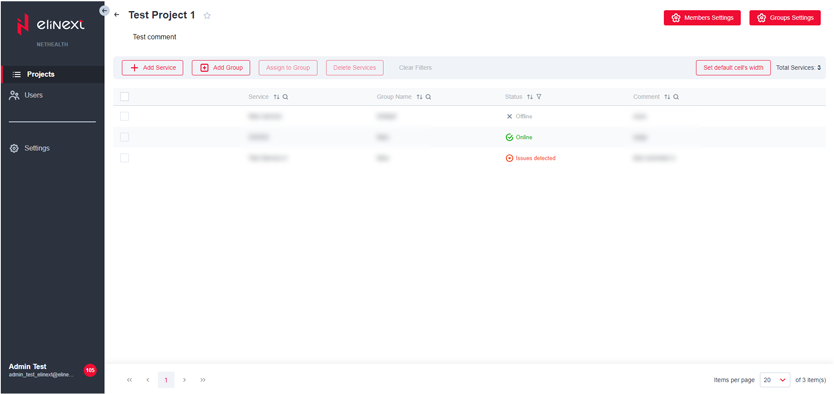
Each project may have several services that are to be monitored. This feature makes it easy to observe services’ general info, status, and groups. It helps with controlling the receiving of notifications and adds a feature to filter a wide range of services by group.
Basically, this feature enables viewing the services in a grid, filtering and sorting information in the grid columns, and assigning services to groups.
Feature: Metrics Checklist
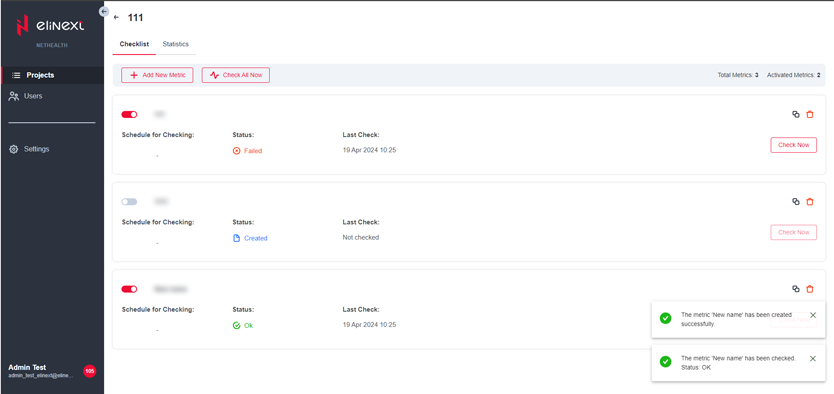
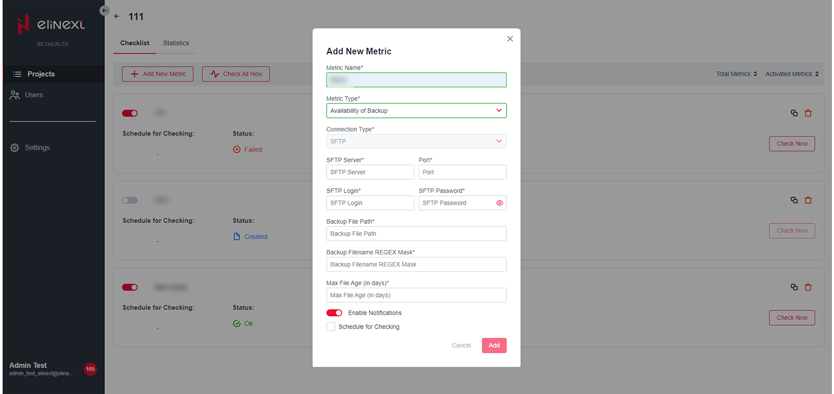
The user can add and monitor various metrics related to the service. The admin can set the schedule for checking once and then receive notifications in case something gone wrong or check one or all the metrics manually to see the latest updates.
Users can copy the existing metrics and rename them.
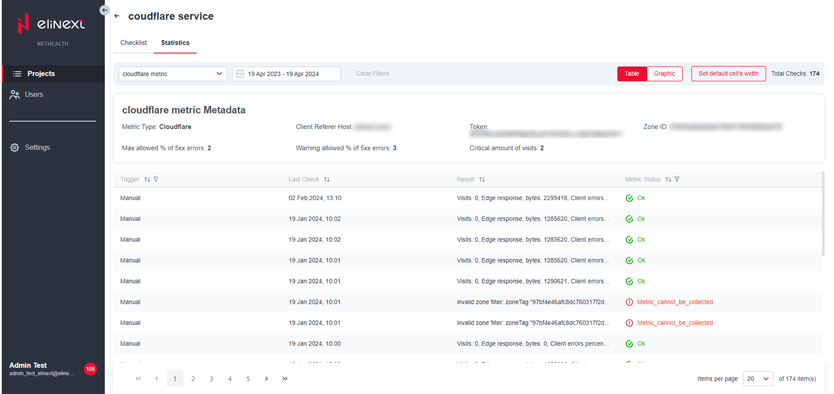
Feature: Stats in Table View
The table view of statistics helps to observe the dynamics of metric check-in details in the form of a table. The user can filter the statistical data by status or trigger, therefore he can make specific conclusions based on returned data.
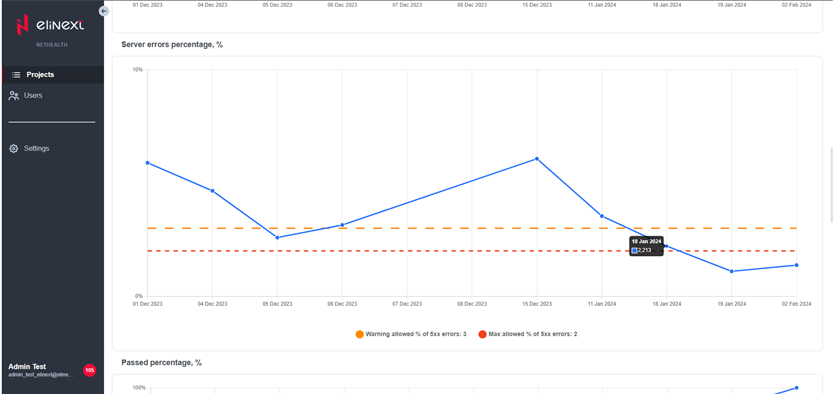
Feature: Stats in Graphic View
The graphic representation of statistics helps to observe the dynamics of metric check results, especially for a long period of time. The user can see how often the results gained the threshold values if they were specified.
Notifications
With notifications, the user is warned about the events in the system on time, especially about some issues with metrics. It helps to take measures to eliminate issues as quickly as possible. In-app and email notifications are enabled, telegram notifications will be available in future versions.
Module Two: Users
A user with sufficient access (administrator role) can see all the users that have access to the system on one page. In user details, the administrator can find general info about the user and projects related to him (name, email, role). It helps to find out how this user gained access to the system.Module Three: Settings
The admin can control the synchronization with the Identity server, so the app retrieves the latest info about the users. Both manual and automated synchronizations are available.Results
Now Elinext administrators are aware of issues with servers and other infrastructure upon their occurrence. All the issues can be resolved immediately, so we aren’t worried about a potential power outage or other calamity of such kind. The consequences of the network being down don’t block the work of Elinext employees to the extent it used to or might have been.
There are some works done on the refinement of the system, and its future versions in the development are upcoming.
Related Cases
Real-Time Fertility Lab Monitoring Project
Web App for IoT Devices Monitoring Network Monitoring Software News Monitoring App Mobile Application for Brain Data Monitoring with BLE Device