


Client
A large telecom software and hardware provider used Elinext to build an application for monitoring physical and virtual network components in real-time.
Project Description
Over the past few decades, the digital economy has been booming. The demand for online services has been growing, and so has the pressure on telecommunication networks. Providers responded by adding new, advanced technology to their systems, but that came at a cost.
At some point, telecom companies had to operate hybrid infrastructures where diverse, advanced software complemented hardware (that was sometimes very old-school). Monitoring such infrastructures was increasingly difficult and cost companies a lot of money.
Our client, a multinational telecom software and hardware provider, approached that challenge with a product upgrade idea. It was a gateway addon that would allow telecom companies to monitor software-defined networking (SDN) and network functions virtualization (NFV). Monitoring hybrid networks was increasingly difficult and cost telecom companies a lot of money. In other words, a new solution had to put hardware and digital components on one screen.
As a part of a huge international project with worldwide distributed teams, Elinext specialists have been developing complex and sophisticated network monitoring and infrastructure management software. Elinext developers and QAs have been involved in serious rework and refactoring of UI approaches, implementing integration with about 15 third-party products, adopting serious quality control processes and standards, and developing and improving a great number of complicated algorithms and applications for over 10 years.
Challenge
The project has been connected with a number of challenges:
- Huge scope of the project covering a large number of international teams of developers, testers, UI designers; a wide range of technologies; various subject domains;
- Active communication with teams in other countries and the customer: different time zones, different languages, different styles of communication;
- Quick learning of the long history of the project and of the huge amount of source code that had been created before, aggravated by the lack of developer documentation;
- Complicated technologies, various forms of clusters;
- Development of software for very expensive and rare equipment at big data centers of telecom providers;
- Cross-platform support;
- Serious UI remodeling;
- Software architecture refactoring;
- Processing vast amounts of data (requiring more space than that available on regular HDDs) with diagnostics optimization, implementation of special filters for diagnostics, and creating own diagnostics tools.
Process
To best cope with the project’s challenges which included discovering new technology, client-specific implementation, and testing and visualizing data in a new way, it was decided to create several independent teams. Within years, the number of Elinext teams allocated for this project increased to 5. All of them are working in close cooperation with more teams both on the side of the customer and other ones in different locations around the globe. Online meetings with foreign colleagues and end customers are conducted at overlapping times, sometimes also with onsite end-customer support. We approached upgrading the product by agile development split into quarterly iterations for each feature.
Elinext specialists have had a lot of internal and external training and have put strenuous efforts into comprehension of various subject domains, technologies, and customer-specific requirements. In addition, they have been involved in keeping up to date with the internal development portal and developer documentation.
The project’s core team has been engaged in the development of the program’s core, as well as storage, transformation, analysis, parallel processing, and data convolution algorithms.
To reduce costs for purchasing very expensive equipment for the Internet and wireless communication providers, a lot of simulation and lab testing has been conducted. For optimization of work with data through the embedded language of data processing, there has been created an API that realizes data logic, and operations on data and optimizes work with databases.
Discovering New Technology
Hybrid network components are interconnected at the host level. And that’s different from the modern default, where system units talk via Docker REST API. Therefore, we had to study how host-based connections worked, how to get data from them, and how to visualize that data.
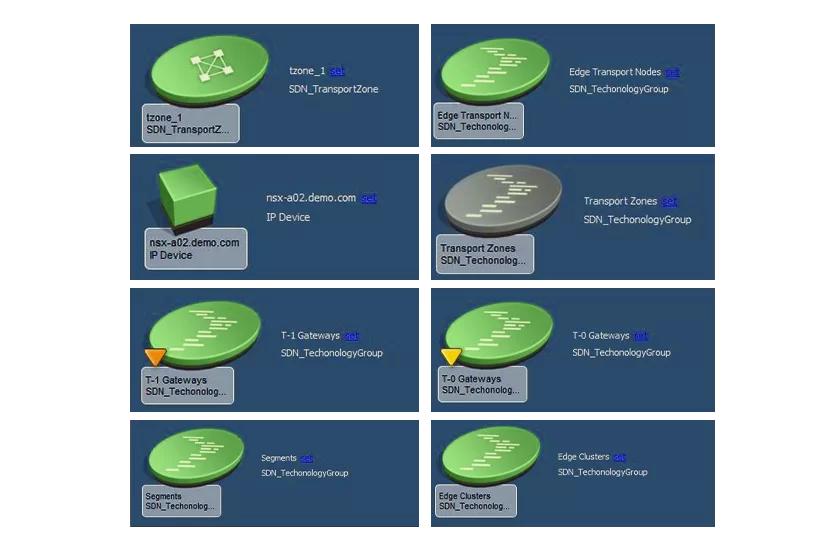
That inquiry led us to learn about VMWare’s NSX-T. This platform has been used by many telecom providers to build software-defined networks (SDN), which the addon was designated to monitor. So, we had to get a sense of how we could pair NSX-T with the existing system and its data processing model.
It took us going over mounds of documentation to understand the essential technology. But that was a crucial first step that laid the groundwork for customizing the product for each end client in the future. Without that groundwork, we would be spending much more time studying telecommunication providers’ networks today.
Implementation and Testing
The upgrade required a few changes made to the core of the original technology stack. The major change was migrating from Oracle to Vertica, and that’s pretty much where one-time upgrades end.
The product implementation isn’t a step that you do once. Every telecommunication company is different when it comes to its network specifics and requirements. And that means we need to use the groundwork we’ve laid with the product to build it anew for every end client. That process usually takes 1.5 months.
Another thing that we’ve developed to use in future customizations is automated tests. We modify them and run them in a network monitoring simulator to make sure all connections within the network perform as expected.
Visualizing Data in a New Way
The client produces a variety of devices. And network switches are the most important ones, as they ensure uninterrupted experiences for each peer in the network.
Every such switch has a chip at its heart, where its functionality is encoded. And digging up that functionality code for monitoring the switches wasn’t an easy task.
First of all, we had to pick apart the code that comes with new types of switches. Those switches sent data via REST API which the original system could not process. So, we worked closely with the client’s admins and engineers to find a way to convert that data and make it usable.
Visualizing the data in a new way required updating the front end. And the original front end ran on an outdated custom framework which was made as a single web page. Although we couldn’t afford to rewrite the framework, we still could develop new React components and integrate them with the old architecture. We built a new frontend on top of what had proven itself indispensable time and again.
Now, this may sound like an easy ride, but that’s far from what transpired. In fact, adding contemporary to the outdated system challenged our expertise like nothing before. But it was worth it: we essentially built a new frontend on top of what had been there for a long time and already proved itself indispensable.
Integration and Customization
Every time an end client wants to use the product with their system, we start by studying the problem and specifying the task. As part of that inquiry, we analyze the client’s network. And that means understanding how specific components work, how to integrate them, and how to get data from them in a digestible format.
Then, as previously mentioned, we build a customized product atop the basis we laid out earlier.
Product
The hardware and software our client supplies form the network backbone for many telecom providers. If anything gets broken, the end user will suffer interruptions in streaming, gaming, or more critical processes. And the product we helped build enables providers to spot issues in advance, across physical and digital dimensions.
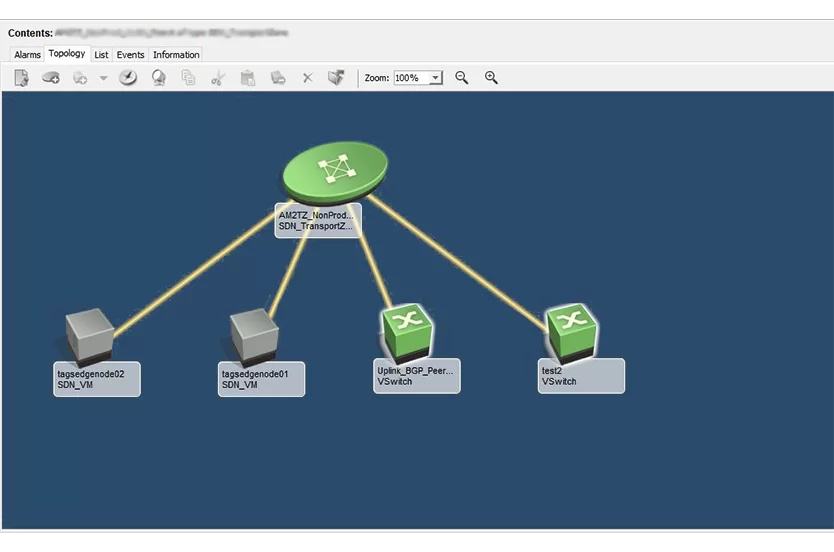
Virtual Switches
Most issues arise at the physical, or the underlay level — on chips that are built-in boxes acting as physical switches. And those issues impact the overlay level — as represented by virtual switches running in clouds and receiving data from virtual machines and containers.
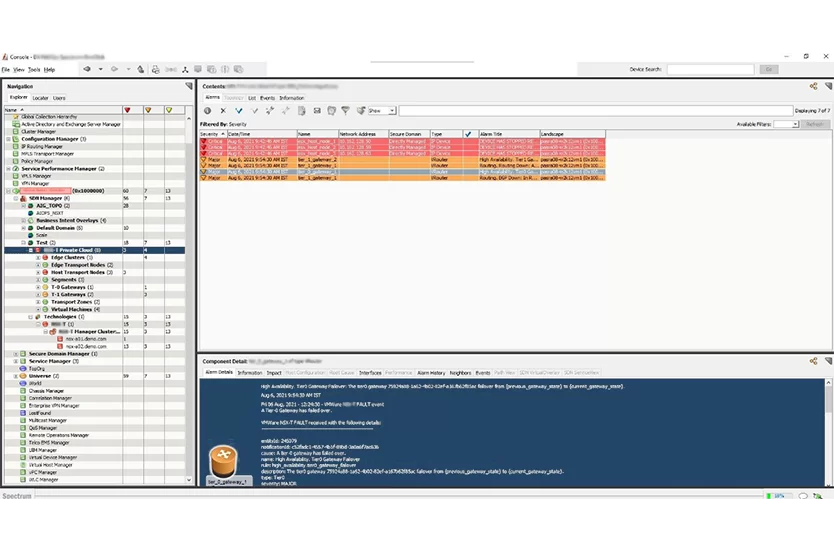
Usually, network admins only notice an error at the overlay level and cannot track down its underlay source. But the product we’ve built changes that.
We established a data exchange between physical and virtual components where admins can localize issues. Once the source of a problem has been discovered, the provider can send a technician to fix the physical switch causing an interruption. Usually, network admins cannot track down physical issues causing interruptions. The product we’ve built changes that.
It’s worth mentioning that VMWare doesn't produce or support hardware. Nevertheless, we managed to visualize software-defined networks built using VMWare NSX-T and hardware indicators within one interface.
Web Interface
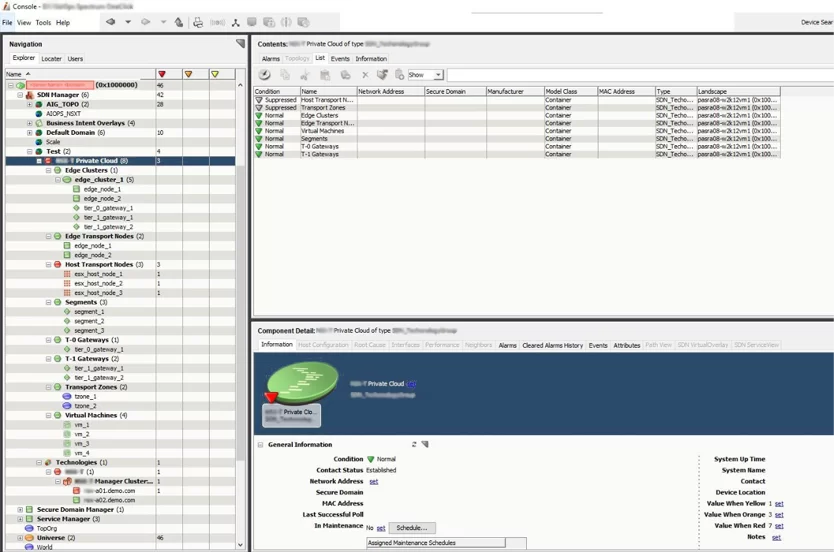
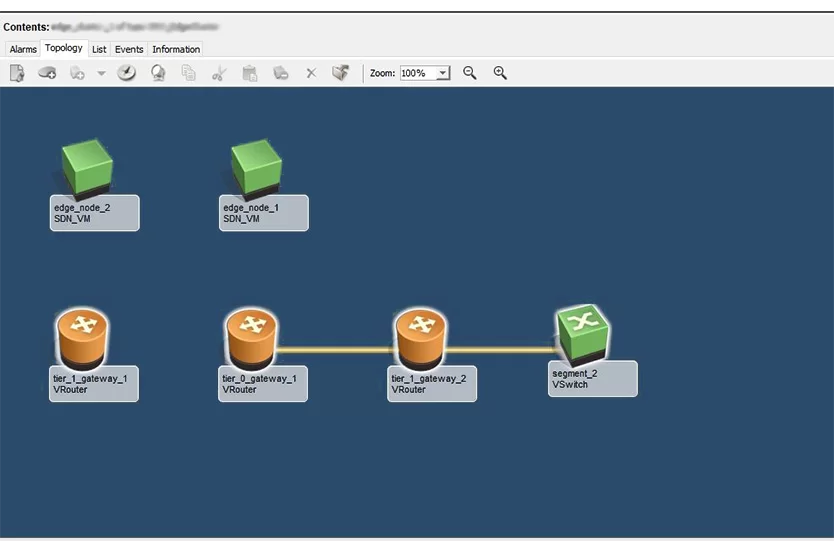
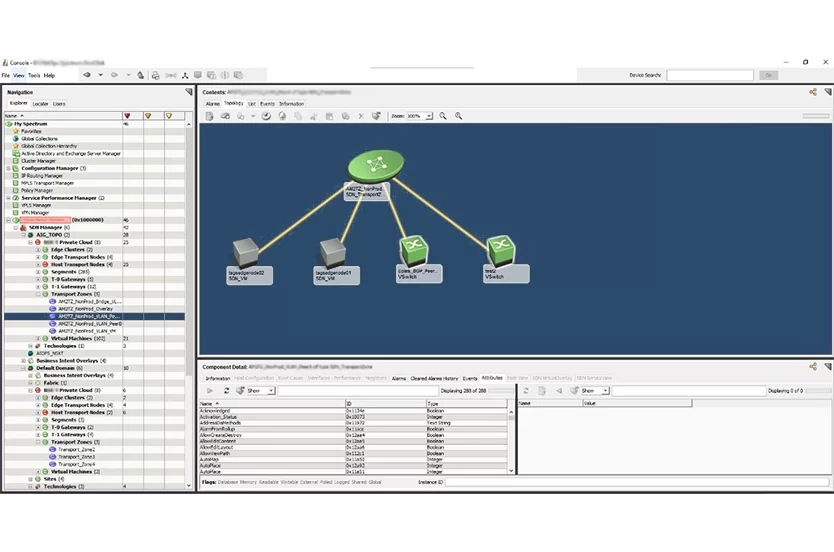
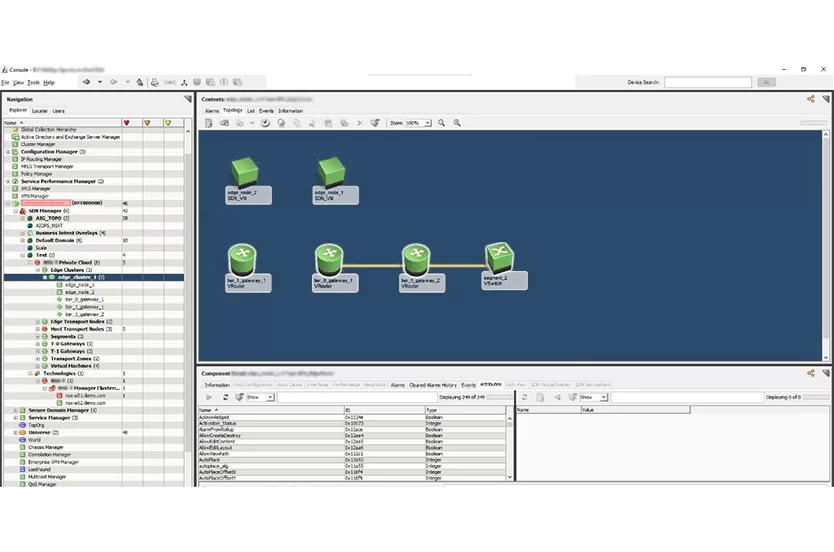
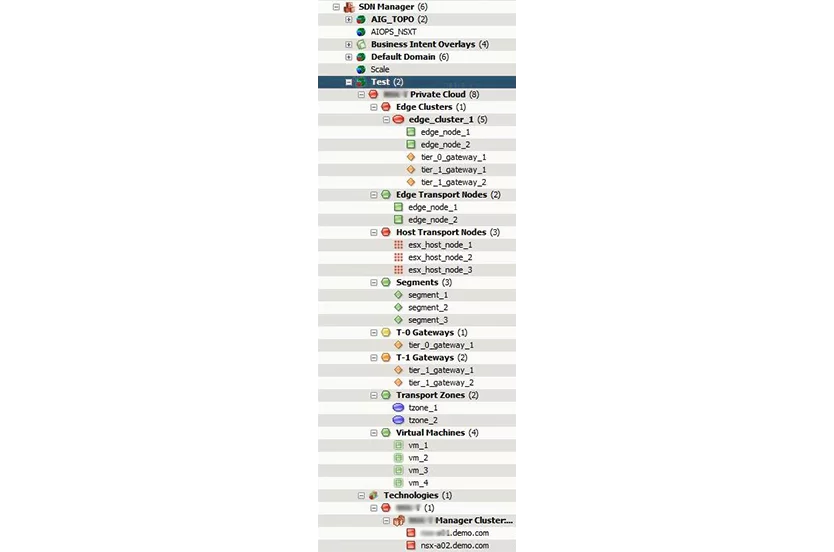
We established a meaningful connection between physical and virtual components. To visualize that connection, we developed a web interface.
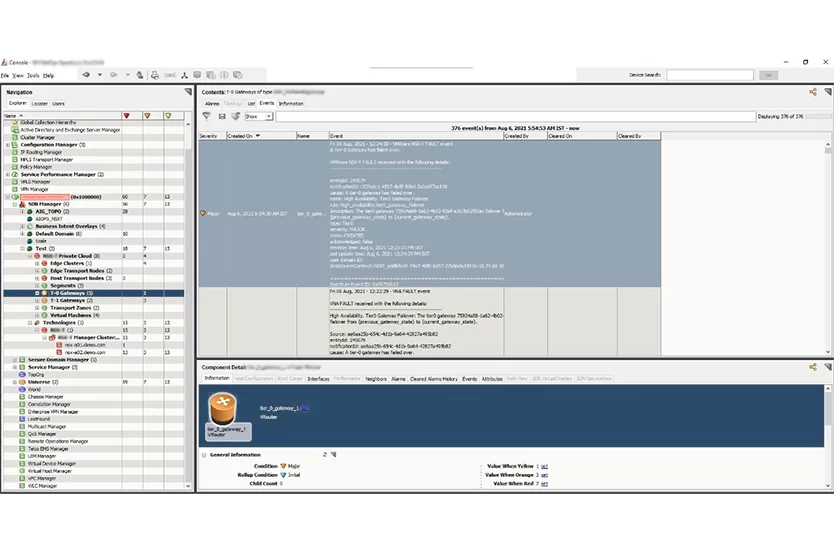
The web interface is the most important part of the product. It includes hundreds of metrics network admins can track, alongside charts and advanced analytics. Essentially, we built a holistic topology of virtual components, displaying them within the interface alongside the physical ones.
In addition to plain switches, admins can use the application to monitor computers and routers that form a network from a user-friendly console. If a network component shuts down due to an error (e.g. when a switch CPU dies), system engineers will receive a notification immediately.
Network Monitoring Simulator
Customization is at the heart of the product. And it takes a lot of testing to ensure that the addon works as expected with an end client’s network. One way to ensure that is by pestering the end client for feedback, which can be bothersome for both parties. But we found a better solution: a network monitoring simulator.
We send each end client a utility program that they install in their system. And that’s all the telecom provider needs to do. The program creates a copy of their virtual network, and we can use that copy for autonomous testing. We created a copy of an end client’s virtual network and use it for autonomous testing.
Once we’ve customized the product for the end client, we roll out the emulated environment. It allows us to run automated integration tests to ensure that connections between network components work properly. And the end client can go about their business as we do so.
Results
Our team helped pioneer a one-of-a-kind application pairing purely virtual and purely physical network switches in the same interface. The outcome of the project is a robust software system that helps thousands of end customers around the world effectively maintain complex IT infrastructure and respond quickly to changing operational needs. The created software provides real-time information about IT infrastructure objects, collects performance statistics about hardware, and allows one to take control of their functioning. And telecom providers benefit from it by securing uninterrupted online experiences for their customers whose demand is ever-growing.