Client
A business analytics company based in Silicon Valley commissioned Elinext to develop financial risk assessment software.
Challenge
This story began in 2011, when an analytics company based in San Jose reached out to Elinext. Operating in multiple markets, this company’s corporate clients had been selling their products in different currencies, which made planning and calculating risks a dynamic challenge.
The company was helping its clients solve this challenge through a web application built using Visual Basic (let’s call it App 1). Users would sign up for the platform and the company’s analysts would perform various currency-related calculations for them.
Doing all the work manually wasn’t efficient, and the tech stack update had been long overdue, so the company considered rebuilding the application. And, having only enough in-house programmers for bug fixing, they searched for help.
Eventually, the company came across Elinext through an online ad. Satisfied with our expertise and pricing, they tasked us with the job — and a journey of more than a decade began.Process
We put together a dedicated team of developers and testers directed by a lead developer. Along the way, the client did some testing, managed servers and actively engaged in release planning. Each release encompassed 10–20 tasks we carried out through the first month and tracked through Jira.
In 2014, after we had rebuilt most of App 1, the client requested an additional module of the system to be built. And that was an application for calculating the real cost of loans and assets over time, drawing upon loan amortization, maintenance and interest rate dynamics.
Rebuilding App 1
The early days of redeveloping App 1 posed a communication challenge. The client had no tech-savvy business analysts to describe the task at hand. What they did was walk us through the broad strokes of the conceived application logic, speaking in mainly financier language.
We studied the vast project documentation, and, in a bit more than a year, rewrote the application using Google Web Toolkit (GWT). After three more months of testing, the application went live.
But the work didn’t end there. Further down the track, we continued collaboration by supporting the application, building new features and fixing occasional bugs.
Developing App 2 From Scratch
When we tackled App 2, we were already speaking the same language with the client. Overall, the process mirrored that of building App 1 and went well until we encountered a problem with the computing platform MATLAB.
We integrated App 2 with MATLAB to enable complex cost calculations across multiple parameters. But it wouldn’t process multiple threads at the same time. As a result, if one user-client had launched a calculation process, others wouldn’t be able to do the same.
Our team solved the problem by building a separate executive module and configured it up to call up a pool of Java processes whenever needed.
Quality Assurance
We reached almost 100% test coverage of the system. To do so, our team used around 500 automated tests run on the TeamCity server at night and about 650 unit tests.
Product
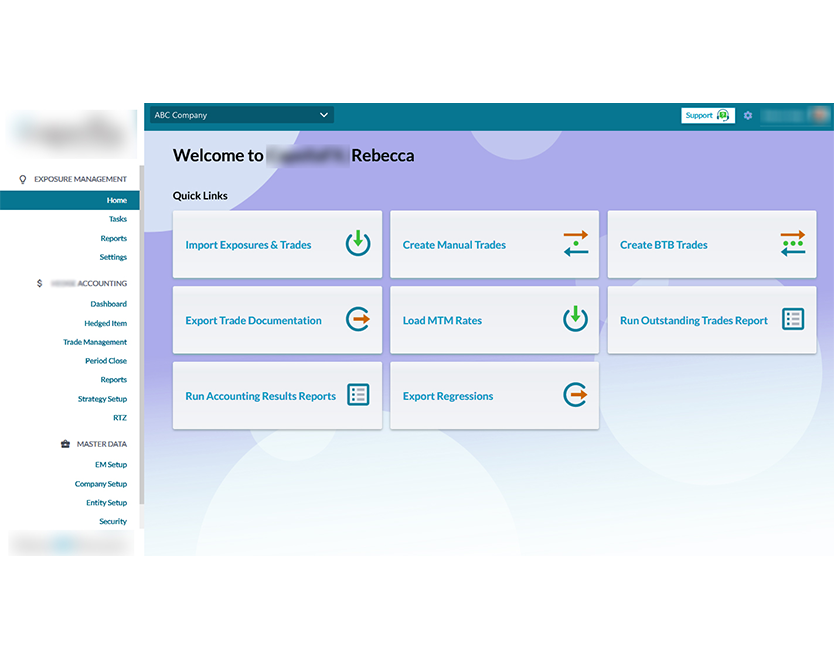
The product - a complex Financial Risk Management Software - consists of two applications: App 1 (for costing multi-currency-associated risks) and App 2 (for pinpointing the real cost of loans and assets over time).
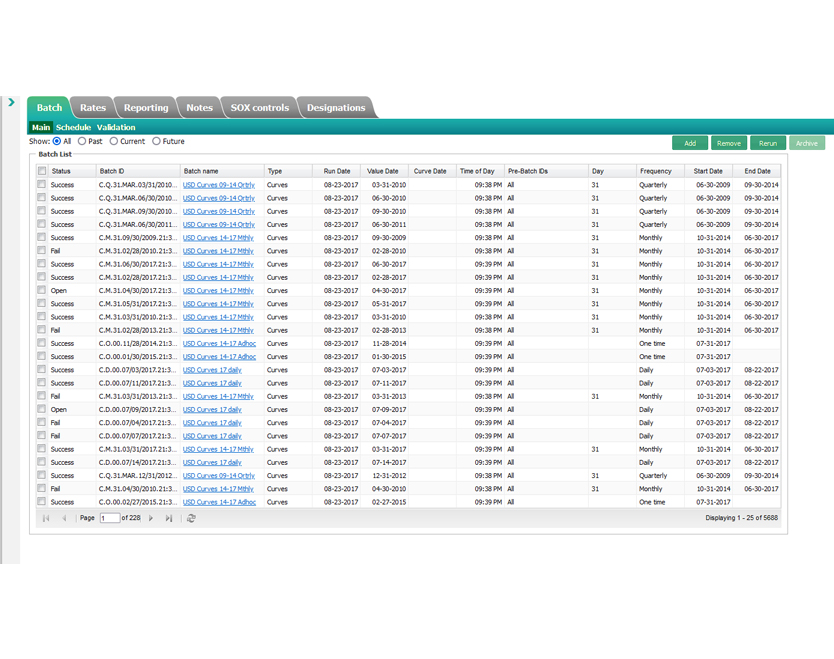
The two applications have one thing in common: they take data from another application, App 3 (previously part of App 2). App 3 connects to a provider of market data like loan rates or exchange rates and transfers it from there to Apps 1 and 2. And that data is further used by the two apps for computing and forecasting.
Let’s take a look at the software’s key modules.
App 1: Company and Entity Setups
The Company Setup screen allows system operators to onboard user-companies, adding these details:
- general business information
- approved financial counterparties
- accounting periods
- active currencies
- regions
- logic for automated exposure
If a company has subdivisions that need to be factored in, our client can through the broad strokes of the conceived application logic, speaking mainly financier language. The Entity Setup includes the subdivision’s general ledger accounts and currency trading conventions.
App 1: Hedge Accounting Dashboard
The Hedge Accounting Dashboard shows graphs for tracking derivative maturity schedules, currency exposure by entity, trends and rate history.

App 1: Hedge Item and Trade Management
In the Trade Management panel, an operator can register trade operations for each client, detailing various parameters. An operation can be closed with figures calculated from the current exchange rate.

App 1: Security: Roles and Permissions
To manage users, assign roles and permissions, manage roles and monitor user activity across the board, system operators can use the Security module.

App 1: Period Close
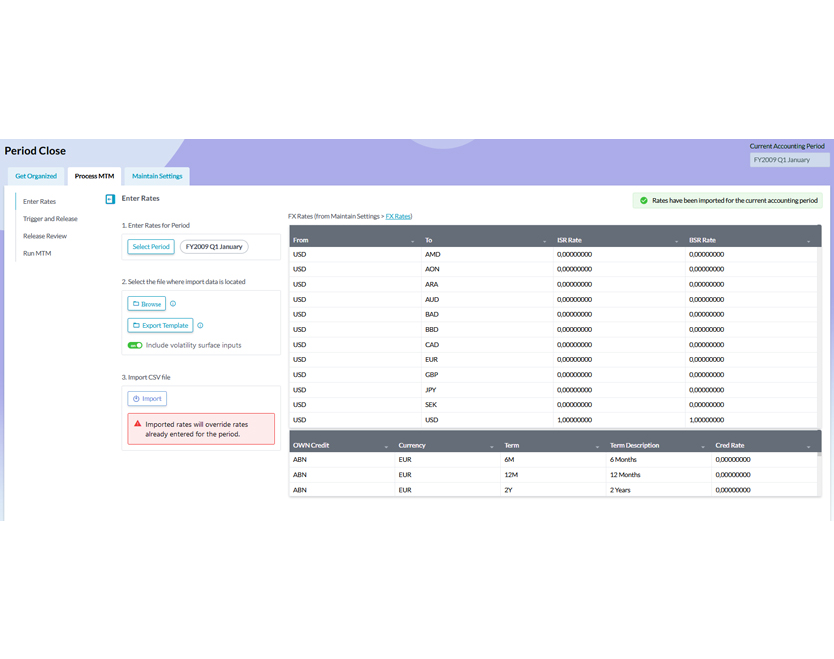
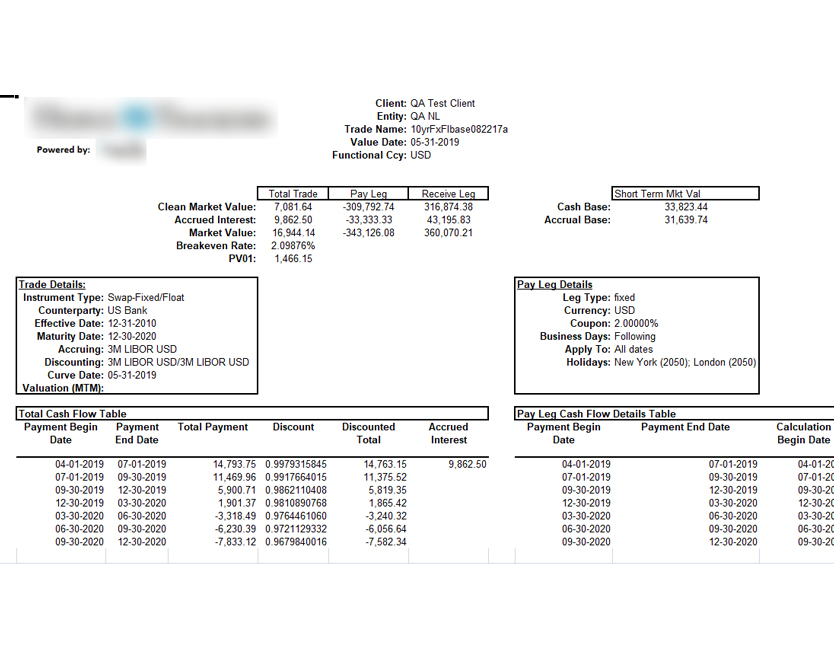
When a business period comes to an end, it can be closed in the Period Close module. In this module, various market-to-market (MTM) parameters (e.g. market value in the active currency) are calculated for each business entity. Operators can configure the settings of MTM calculations.
App 1: Reporting
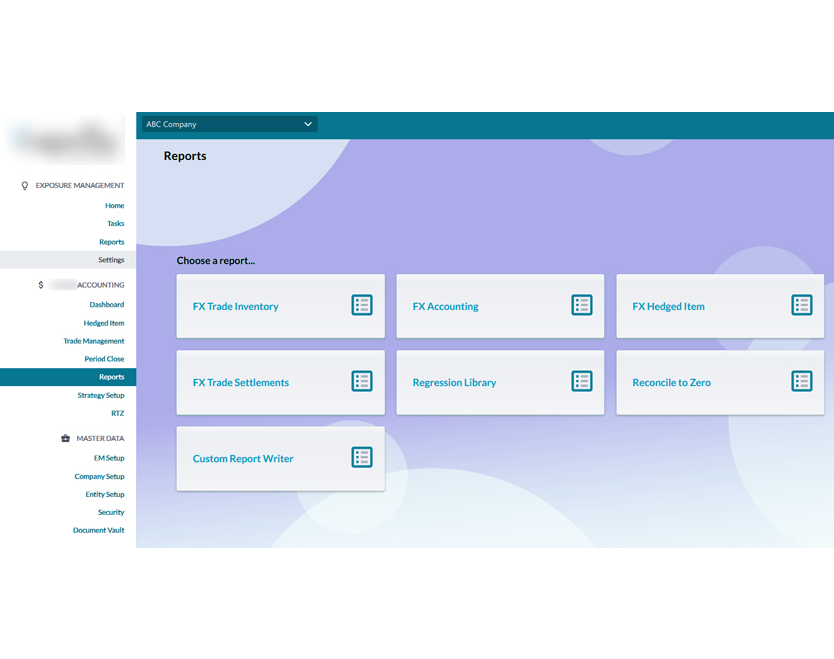
This module offers two types of reports: regular reports and RTZ reports. And regular reports are further broken down into 50 more subtypes like trade inventory, accounting, hedge items and others.
In addition, we built a custom report writer using the Jasper Reports engine.
App 1: RTZ Storage Vault
To allow system users to keep their reports and other related documents online and at hand, we built the RTZ Storage Vault.
App 2: Setup
The App 2 Setup module resembles that of App 1. Operators can also use it to configure client records, manage users and roles, fill in company information, add entities and configure trade strategies.
App 2: Valuations and Trade Management
Valuations are the main calculation module in App 2. Using it, operators can monitor rates received from App 3 and manage other related data.
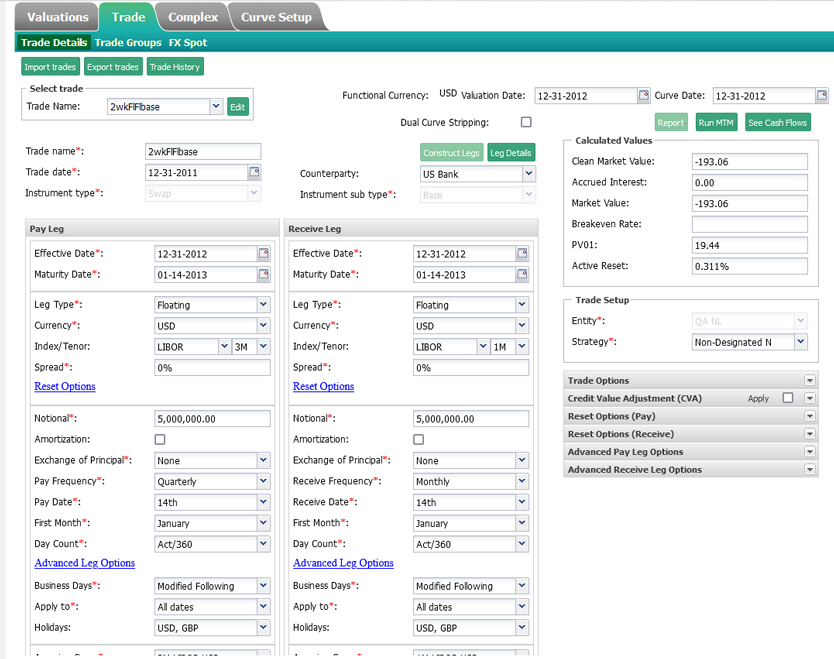
Trade operations available in Trade Management come with dozens of settings and parameters like payment legs, receiving legs and many more.
While App 1 provides static forecasts for a particular point in time, this module can be used to present expected cost volatility in two ways: curves and matrices. Just like curves, matrices show cost changes against key interest rates and strike — but there’s also a third dimension, that being the term.
The visualization is based on data from App 3, including mark-to-market value, accrued interest, pv01, breakeven rate, active reset and many more.

App 2: Period Close
This module is similar to the Period Close module presented in App 1. It can be used to complete periods and create reports.
App 2: Reporting
The Reporting module in App 2 is simpler than the one in App 1. It includes four types of reports, such as MTM Detail (basic), MTM History (past dates), ME Summary, Custom (a custom report builder for using any spreadsheets and any calculations). Users can create custom reports by placing xls tags across documents.
Operators can schedule report launches in advance. And users can subscribe to getting specific reports automatically.
Results
Over the course of eleven years, the client had been intensively using our help. And the number of big corporations using the system grew by the dozens as we developed it.
In 2022, the company’s CEO retired and sold the product - the Financial Risk Management Software - to a larger transnational corporation. They changed the whole concept of the software, and our involvement, as well as that of most of the original staff, came to a close.
This project has been instructive from beginning to end. We upgraded our skills at enabling massive calculations and learned to work with complex financial parameters, pulling them from external sources and processing them.

