In the vast landscape of programming languages, Java stands as a cornerstone, celebrated for its cross-platform compatibility and robust performance. At the heart of Java’s efficiency and consistency lies its sophisticated memory management system, an integral component of the Java Virtual Machine (JVM).
Welcome to an in-depth exploration of the JVM memory model—an intricate architecture that governs how Java applications allocate, use, and release memory resources. From the smallest applets to sprawling enterprise software, the memory model plays a pivotal role in ensuring the stability, performance, and responsiveness of Java applications.
This article embarks on a journey into the intricacies of the JVM memory model, offering a comprehensive understanding of the principles that drive memory allocation, object lifecycle, and garbage collection. Whether you’re a seasoned Java developer seeking to optimize your code’s memory usage or a newcomer intrigued by the mechanisms underpinning Java’s versatility, this exploration will shed light on the underlying magic that enables Java’s “write once, run anywhere” promise.
We’ll dissect the various memory regions within the JVM, each with a specific purpose and role in the execution of Java programs. From the method area that stores class structures to the heap where objects live, and the thread stacks that facilitate multi-threading, we’ll uncover how these components interact to create a seamless execution environment for your code.
Understanding the JVM memory model extends beyond efficient programming; it’s a gateway to crafting more robust and scalable applications. In a world where resource optimization and responsive user experiences are paramount, comprehending how Java manages memory is an indispensable skill for developers across industries.
Join us as we peel back the layers of the Java Virtual Machine memory model, revealing the mechanisms that make Java applications efficient, adaptable, and truly platform-independent. Whether you’re embarking on a new Java project or looking to enhance your existing skills, this journey into the heart of memory management will undoubtedly enrich your programming prowess.
JVM
The Java Virtual Machine (JVM) is a key component of the Java platform that enables the execution of Java applications. It provides an environment that abstracts the underlying hardware and operating system, allowing Java programs to be written once and run anywhere (WORA). The JVM interprets and executes Java bytecode, which is a compiled form of Java source code.
Key features and components of the JVM:
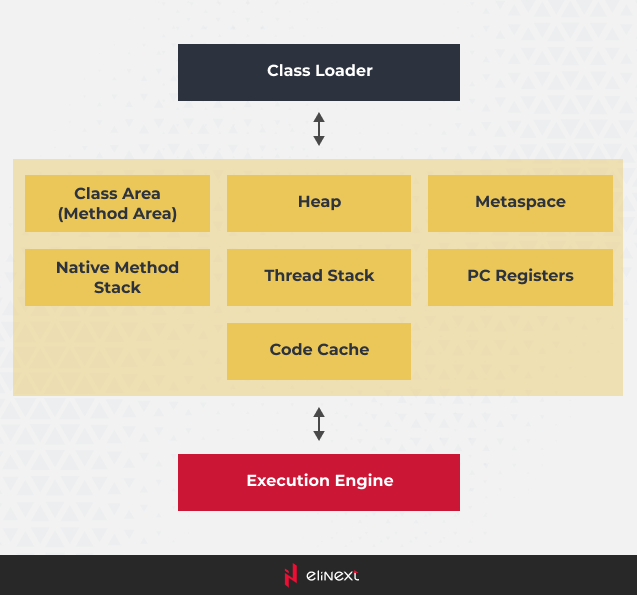
1. Class Loader: Loads classes and resources into memory as needed. The class loader subsystem manages class loading, linking, and initialization.
2. Execution Engine: Executes Java bytecode. Depending on the JVM implementation, bytecode is either interpreted or compiled to native machine code for execution.
3. Runtime Data Areas:
- Method Area: Stores class metadata, constants, and static variables.
- Heap: Manages object instances and arrays, including the Young and Old Generations.
- Thread Stacks: Each thread has its own stack, used for method call and local variable storage.
- PC Registers: Store the address of the currently executing instruction.
- Native Method Stacks: For native methods (methods implemented in languages other than Java).
4. Garbage Collection (GC): Reclaims memory by identifying and removing objects that are no longer reachable. Different GC algorithms provide various trade-offs between throughput and pause times.
5. Just-In-Time (JIT) Compiler: Compiles bytecode into native machine code at runtime. This improves execution speed compared to pure interpretation.
6. Java Native Interface (JNI): Allows Java code to interact with native code and libraries written in languages like C and C++.
7. Java API: A rich set of standard libraries and classes that provide core functionality for Java applications.
8. Security Manager: Enforces security policies to protect against unauthorized access and malicious behavior.
9. Java Monitoring and Management Tools: Provides tools for monitoring and managing the JVM, including profiling, diagnostics, and performance analysis.
10. Threading and Synchronization: Enables multi-threading and synchronization, allowing developers to write concurrent and multi-threaded programs.
The JVM ensures platform independence by abstracting hardware-specific details. Java applications are compiled into bytecode, which is executed by the JVM on the target platform. This bytecode is portable and can be run on any system with a compatible JVM implementation, making it a key area of expertise for a Java development company.
Different vendors provide their own implementations of the JVM, each with variations in performance, features, and optimizations. Examples of popular JVM implementations include Oracle HotSpot, OpenJ9, and GraalVM.
Overall, the JVM is the foundation that enables Java’s “write once, run anywhere” promise, making it one of the key factors contributing to Java’s popularity and success.
JVM memory model
The Java Virtual Machine (JVM) memory is divided into several distinct regions or memory areas, each serving a specific purpose. These memory areas collectively manage the allocation, usage, and deallocation of memory for running Java applications. Here are the main JVM memory areas:
Class Area (Method Area):
- Also referred to as the “Method Area” or “Class Metadata Area”.
- Stores metadata about classes, methods, fields, and other structural information of loaded classes.
- Shared among all threads and is read-only once classes are loaded.
- In Java 8 and later, the “PermGen” space from older versions was replaced with “Metaspace,” which is a more flexible and dynamically sized memory area.
Heap:
- The Heap serves as the area within runtime where objects are allocated.
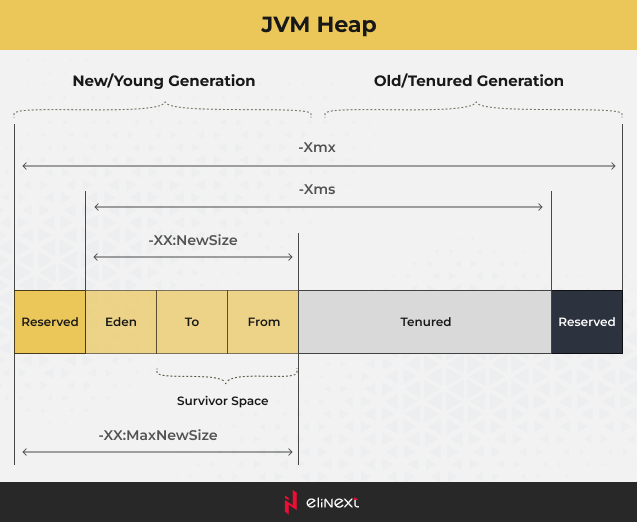
- Divided into the “Young Generation” and the “Old Generation” (Tenured Generation).
- The Young Generation further consists of the “Eden Space” and two “Survivor Spaces”.
- Most of the objects start in the Young Generation and may be promoted to the Old Generation as they survive garbage collection cycles.
- Managed by the Garbage Collector to reclaim memory occupied by objects that are no longer referenced.
Eden Space:
- Part of the Young Generation.
- Initial allocation area for objects.
- Objects that survive a minor garbage collection are moved to the Survivor Spaces.
Survivor Spaces:
- Also part of the Young Generation.
- Objects that survive a garbage collection in the Eden Space are moved to one of the Survivor Spaces.
- Objects that continue to survive multiple cycles might eventually be promoted to the Old Generation.
Old Generation (Tenured Generation):
- Holds long-lived objects that have survived multiple garbage collection cycles.
- Larger and more persistent than the Young Generation.
- Major garbage collection events (Full GC) target this area.
Metaspace:
- Replaced the Permanent Generation (PermGen) starting from Java 8.
- Stores class metadata, method information, and other runtime structures.
- Dynamically sized and managed by the JVM, typically using native memory.
- Helps prevent issues related to memory leaks caused by inadequate PermGen space sizing.
Native Method Stacks:
- Each thread running in the JVM has its own native method stack.
- Contains information about native methods used in the application.
- Memory for these stacks is allocated by the operating system.
Thread Stacks:
- Each thread has its own private Java stack, containing information about method calls, local variables, and state.
- Stack frames are pushed and popped as methods are entered and exited.
Program Counter Registers:
- Each thread has its own program counter (PC) register.
- Keeps track of the currently executing instruction.
Code Cache:
- The code cache is used to store compiled native code generated by the Just-In-Time (JIT) compiler.
- It helps improve execution performance by storing compiled versions of frequently executed bytecode.
These memory areas work together to manage the memory consumption of a Java application, including the storage of objects, method metadata, and other runtime information. The Java Garbage Collector plays a crucial role in maintaining the memory by identifying and collecting unreferenced objects. Different garbage collection algorithms and strategies are used to optimize memory management and application performance.
Class Area (Method Area)
The “Class Area”, also known as the “Method Area”, is a region of memory within the JVM that stores metadata and information about loaded classes, methods, fields, and other structural elements of Java programs. It’s a critical part of the JVM’s memory structure and is responsible for maintaining the runtime representation of classes and their related data.
Key characteristics of the Class Area:
- Metadata Storage: The Class Area stores information about classes themselves, not instances of those classes. This includes data like method signatures, field names, access modifiers, and other structural details.
- Shared Across Threads: The Class Area is shared among all threads running in the JVM. This is because classes and their metadata are common to all instances of a class.
- Read-Only After Loading: Once classes are loaded and their metadata is stored in the Class Area, it becomes read-only. This means that the structural information of classes is not typically modified at runtime.
- Permanent Generation and Metaspace: In older versions of Java (up to Java 7), the Class Area was part of the “Permanent Generation” (PermGen) memory space. However, starting from Java 8, the concept of PermGen was replaced by “Metaspace,” which is a more flexible and dynamically sized memory area for class metadata storage.
- Metaspace: Metaspace is managed by the JVM and can grow or shrink as needed based on the application’s class loading requirements. It helps prevent issues related to memory leaks caused by inadequate PermGen space sizing.
- Garbage Collection: While class instances are managed by the garbage collector in the “Heap” memory area, the metadata itself in the Class Area or Metaspace is managed separately. As classes become unreachable (e.g., the corresponding class loader is no longer reachable), the JVM can reclaim the memory occupied by their metadata.
- Native Memory: Metaspace uses native memory (memory from the operating system) to store class metadata, which can help improve memory efficiency compared to the older PermGen area.
It’s important to note that while the Class Area/Metaspace is important for maintaining class information, it’s usually not a primary concern for most Java developers. JVM memory management, including class loading and garbage collection, is typically handled transparently by the JVM itself.
Heap
The Java Virtual Machine (JVM) heap is the runtime data area where Java objects are allocated and managed during the execution of a Java application. The heap is a crucial component of the JVM’s memory management system, responsible for handling memory allocation, object lifecycle, and garbage collection.
Here are some key points about it:
- Memory Allocation: When an object is created in Java using the ‘new’ keyword, memory is allocated for that object on the heap. The allocation typically happens in the Eden space, which is specifically designed for short-lived objects.
- Generational Garbage Collection: The heap is managed using a generational garbage collection approach. This means that objects are categorized into different generations based on their age and how long they have been alive. The main idea is that young objects (recently created ones) are more likely to become garbage, while older objects tend to live longer. Different garbage collection strategies are applied to each generation.
- Minor and Major Garbage Collections: Minor (young) garbage collections are responsible for cleaning up short-lived objects in the Eden and Survivor spaces. When the Eden space becomes full, a minor collection is triggered to identify and reclaim memory from short-lived objects that are no longer reachable. Objects surviving multiple minor collections in the Survivor spaces are eventually promoted to the Tenured space. Major (old) garbage collections are responsible for cleaning up the Tenured space and are less frequent but more time-consuming.
- Heap Size Configuration: The JVM heap size can be configured using command-line options such as ‘-Xms’ (initial heap size) and ‘-Xmx’ (maximum heap size). Setting appropriate values for these options is important for efficient memory usage and application performance.
- Out of Memory Errors: If the heap becomes exhausted and there is not enough memory to allocate new objects or perform garbage collection, the JVM throws an “Out of Memory” error.
- Tuning: Tuning the JVM heap and garbage collection settings is a critical aspect of optimizing application performance. Different applications have different memory usage patterns, so it’s important to analyze and adjust these settings based on the specific needs of your application.
In summary, the JVM heap is the memory area where Java objects are stored and managed. The heap’s structure and garbage collection mechanisms are designed to optimize memory usage and object lifecycle management, contributing to the overall efficiency and stability of Java applications.
Eden Space
The heap is divided into several regions, with one of them being the Eden space. The Eden space is where newly created objects are initially allocated. Upon initialization, newly created objects are allocated in the Eden space. Over time, if these objects survive a garbage collection cycle, they may be promoted to older generations (like the Survivor and Tenured spaces) in the heap.
The purpose of dividing the heap into different spaces is to optimize memory management and garbage collection. Objects that don’t survive very long are quickly deallocated from the Eden space during a minor garbage collection, freeing up space for new objects. Objects that do survive are moved to the Survivor space and eventually to the Tenured space if they continue to survive.
The Eden space is usually part of a generational garbage collection scheme. This scheme is based on the observation that most objects become unreachable shortly after they are created, so it’s efficient to separate short-lived objects (allocated in Eden) from long-lived objects (promoted to Survivor and Tenured spaces).
Survivor Spaces
One of the other heap’s regions is the Survivor space. Survivor spaces are part of the generational garbage collection strategy used by the JVM to manage memory and improve garbage collection efficiency. Survivor spaces play a crucial role in this strategy, particularly in managing the lifecycle of short-lived objects.
If the Eden space becomes full after a garbage collection cycle, objects that are still alive (surviving objects) are moved to the Survivor spaces. The purpose of the Survivor spaces is to act as a buffer between the Eden space and the Old generation. Survivor spaces hold objects that have survived at least one minor garbage collection cycle.
The JVM uses these spaces to identify and separate objects that continue to survive and objects that become garbage relatively quickly. It also adjusts the aging of objects in the Survivor spaces based on their survival patterns. Objects that are still alive after several minor collections are considered older and are more likely to be promoted to the Old generation. This helps optimize garbage collection by minimizing the overhead of moving short-lived objects while promoting objects that are likely to be long-lived.
The sizes of the Survivor spaces can be configured using JVM command-line options such as ‘-XX:SurvivorRatio’, which determines the ratio of Eden space to each Survivor space.
In summary, Survivor spaces help manage the lifecycle of objects by separating short-lived objects from long-lived ones, allowing for more efficient memory management and garbage collection.
Old Generation (Tenured Generation)
Objects that have survived a certain number of minor garbage collection cycles in the Young Generation (Eden and Survivor spaces) are promoted to the Old Generation. This promotion process is based on the assumption that objects that have survived multiple collections are likely to live for a longer time. These objects are considered long-lived or tenured objects. They are often important data structures, application state, or objects with prolonged lifetimes.
The Old Generation is subject to major garbage collection, also known as a full garbage collection or Old collection. Major collections are less frequent but more time-consuming compared to minor collections. They involve examining and collecting garbage from the Old Generation, compacting memory, and freeing up space. If the Old Generation becomes full and there’s not enough space for new objects or for garbage collection, the JVM may throw an “Out of Memory” error specific to the Old Generation.
In summary, the Old Generation (Tenured space) in the JVM heap is responsible for storing long-lived objects. Proper management and tuning of the Old Generation are crucial for overall JVM performance. This includes setting the appropriate heap size for the Old Generation using the -XX:MaxHeapSize option and monitoring the memory usage patterns of long-lived objects.
Metaspace
Metaspace refers to a memory area in the JVM that’s used to store class metadata and other reflective information, replacing the older “PermGen” (Permanent Generation) memory area in Java 8 and later versions. The PermGen space was used in older Java versions to store class metadata, but it had limitations and could lead to issues like “OutOfMemoryError: PermGen space”.
Metaspace, introduced in Java 8, is a more flexible and dynamic memory region that’s allocated from the native memory of the operating system. Here are some key points about JVM Metaspace:
- Class Metadata Storage: Metaspace is responsible for storing class metadata, such as class names, method names, field names, annotations, and other reflective information. This metadata is necessary for Java’s dynamic features, including reflection and runtime type information.
- No Fixed Size: Unlike the PermGen space, which had a fixed size, Metaspace dynamically allocates memory from the operating system as needed. This helps prevent issues like “PermGen space” errors and allows Java applications to utilize available system memory more efficiently.
- Automatic GC: Metaspace memory is managed by the JVM’s garbage collector. It’s important to note that the GC for Metaspace mainly focuses on reclaiming memory used by discarded class loaders and their associated metadata.
- Tuning: While Metaspace doesn’t have a fixed maximum size like PermGen, it can still be tuned using JVM command-line options like ‘-XX:MaxMetaspaceSize’ to specify an upper limit for Metaspace memory usage.
- Native Memory: Metaspace is allocated from the native memory of the operating system, which means it’s not subject to the same memory constraints as the Java heap. However, excessive Metaspace memory usage could potentially affect the overall performance of the application or the system.
- Metaspace Fragmentation: Metaspace does not suffer from the same fragmentation issues that could occur with PermGen space, since it’s allocated from the native memory pool.
In summary, Metaspace is an improvement over the older PermGen memory area. It dynamically allocates memory from the native memory pool, making it more flexible and efficient compared to PermGen’s fixed-size allocation from the JVM heap. Metaspace also benefits from better memory management and garbage collection, leading to improved application stability and reduced memory-related issues.
Native Method Stacks
Native method stacks are a part of the memory management system that is separate from the Java heap. These stacks are used to manage and execute native methods, which are methods written in languages other than Java, such as C or C++. Native methods are often used to interface with system-level operations or to take advantage of platform-specific functionalities.
Here’s how native method stacks work and how they differ from the Java heap:
Native Method Stacks:
- Native method stacks are used to manage the execution of native methods. Each thread in a Java application has its own native method stack associated with it.
- These stacks contain information required to execute native methods, including parameters, local variables, and function call information.
- The size of each native method stack is typically smaller than the Java thread’s stack (which contains Java method calls), but it depends on the platform and configuration.
Java Heap vs. Native Method Stacks:
- Java Heap: The heap is used to store Java objects and their associated data. It’s the region of memory where most of the Java application’s runtime data is stored.
- Native Method Stacks: These stacks are used exclusively for executing native code. They are separate from the heap and the Java thread’s stack.
- Java Thread Stack: Each Java thread has its own stack for managing Java method calls. This stack is used to store local variables, method call information, and other data related to Java method execution.
Memory Separation:
- Native method stacks are allocated in native memory, often outside the control of the JVM’s garbage collector.
- The separation of memory for native method stacks helps prevent conflicts between the execution of native code and the management of Java objects.
It’s important to note that managing native method memory can be more challenging than managing Java heap memory, as the JVM has less control over native code execution and memory management. Incorrect memory management in native code can lead to crashes, memory leaks, and other unpredictable behavior.
As with other memory-related aspects of the JVM, understanding and managing native method stacks effectively can require careful consideration of the application’s architecture, workload, and platform. Always refer to the documentation for your specific JVM version and platform for accurate and up-to-date information on native method stack management.
Thread Stacks
Thread stacks play a crucial role in managing the execution of Java threads in the JVM. Each thread in a Java application has its own dedicated stack space, known as a thread stack. Thread stacks are used to store local variables, method call information, and other data related to the execution of Java methods.
Here’s a breakdown of thread stacks in the JVM:
Thread Stack Basics:
- Each Java thread has its own thread stack, which is a region of memory dedicated to that thread’s execution.
- The thread stack is divided into frames, with each frame corresponding to a method invocation. It contains information about the method’s local variables, its state, and the location to return once the method completes.
Role of Thread Stacks:
- Thread stacks are used to manage the execution of Java methods and to track the flow of program control within each thread.
- When a new method is called, a new frame is added to the thread stack to hold information about that method’s execution.
- As methods are called and return, frames are pushed onto and popped off the stack.
Stack Size:
- The size of each thread’s stack is platform-dependent and can be configured during JVM startup using command-line options like -Xss followed by a value representing the stack size.
- A larger stack size allows deeper method call hierarchies but consumes more memory.
Stack Overflows:
- A stack overflow occurs when the thread stack runs out of space due to excessive method invocations, leading to an exception (usually StackOverflowError).
- Recursive methods that don’t have a proper base case can trigger stack overflows.
Thread stack management is an essential aspect of the JVM’s memory management and plays a role in maintaining the concurrency and parallelism of a Java application. It’s important to consider stack sizes carefully, especially when dealing with applications that require deep call hierarchies or multi-threading.
Program Counter Registers
The Program Counter (PC) is a fundamental concept in computer architecture that exists in various computing systems, including the JVM, and it plays a crucial role in controlling the flow of program execution.
Here’s an explanation of the Program Counter and its role:
Program Counter (PC):
- The Program Counter, also known as the Instruction Pointer (IP) in some architectures, is a special register that holds the memory address of the next instruction to be executed by the CPU.
- As the CPU executes instructions, the PC is automatically incremented to point to the next instruction in memory.
- The PC allows the CPU to sequentially fetch and execute instructions, which is the fundamental operation in a computer’s operation.
Function in Control Flow:
- The PC is essential for controlling the flow of a program’s execution. It establishes the sequence in which instructions are executed.
- When a method or function call is encountered, the PC stores the address of the first instruction in that method’s code.
Role in the JVM:
- In the context of the JVM, the Program Counter keeps track of the current execution point within a method’s bytecode.
- When a Java method is invoked, the PC points to the first instruction of that method.
- As the method executes, the PC is updated to point to the next instruction to be executed.
Not Stored in Heap:
- The Program Counter is not part of the memory management system, and it is not stored in the heap or any other memory region.
- It’s a special-purpose register within the CPU itself.
Concurrency and Multithreading:
- In a multithreaded environment like the JVM, each thread has its own Program Counter.
- Threads execute concurrently, and their respective Program Counters determine the instructions they execute.
Exception Handling:
- When an exception occurs, the PC helps determine the correct exception-handling code to execute.
The Program Counter is a fundamental concept that is managed by the CPU and is not explicitly managed by software developers. Understanding the Program Counter’s role helps developers grasp how programs are executed and how control flow is managed within a computing system.
Code Cache
Code Cache is a separate memory area within the JVM that is used to store compiled native code generated by the Just-In-Time (JIT) compiler, a dynamic compiler that translates Java bytecode into optimized machine code for execution by the CPU. The primary purpose of the Code Cache is to improve the performance of Java applications by caching these compiled code snippets.
Here’s an explanation of the Code Cache in the context of the JVM:
- The Code Cache is a memory area used to store compiled machine code generated by the JIT compiler from Java bytecode.
- The JIT compiler takes frequently executed Java bytecode and compiles it into native machine code to improve execution speed.
- The compiled code in the Code Cache is optimized for the underlying hardware architecture.
- By storing the compiled code, the JVM avoids the need to repeatedly interpret the same bytecode, resulting in faster execution times for frequently used methods.
It’s important to note that the Code Cache is a separate memory area from the Java heap. While the Java heap stores objects and their data, the Code Cache stores compiled native code. This separation helps optimize both memory usage and execution speed.
The Code Cache has a limited size, and it’s important for the JVM to manage it effectively to avoid running out of space. The contents of the Code Cache can be cleared and recompiled as needed based on factors such as method profiling and usage patterns.
Conclusion
To sum it up, the JVM memory model is the backbone of how Java manages memory while your programs run. Its well-structured organization ensures that your code runs efficiently and doesn’t waste resources. Just as a well-organized workspace boosts productivity, the memory model’s careful allocation and smart cleanup keep Java applications running smoothly.
From the way it handles objects’ lifecycles in the Heap to optimizing code execution with the Code Cache, the memory model is like a symphony conductor, orchestrating various memory areas to create harmonious software performance. Its dynamic nature adapts to different workloads, and its seamless management frees developers from memory-related worries, allowing them to focus on building innovative applications.
In essence, the JVM memory model isn’t just about memory—it’s about efficiency, portability, and a foundation that empowers Java to thrive in a diverse range of computing environments. As technology evolves, the memory model remains a steadfast pillar of Java’s success, ensuring that the language continues to excel in the ever-evolving world of software development.

